Purpose
Menieres Biometrics takes audiograms and stores results for review and analysis. It can be used by anyone who wants to track hearing levels over time, but it was written with Meniere's disease patients in mind. Meniere's patients generally exhibit the "Meniere's triad": hearing loss, vertigo, and tinnitus (ear fullness or pressure is often added to that list). Menieres Biometrics tracks hearing loss and provides a log where you can record vertigo events and changes in tinnitus, medication, and subjective measures of other symptoms often associated with Meniere's. The key output is a "trends" plot that shows hearing changes over time, along with indicators of the items in the event log, visually illustrating the correlations between hearing level, vertigo, and other logged events. You can also include weather (temperature, pressure, and humidity) on the trends plot.
Using Menieres Biometrics is a long-term investment. The trends plot will mean little when it covers only a few days. Patterns will only become evident when hearing levels have been observed over an extended period, covering several periods of disease activity and inactivity.
Menieres Biometrics is focused on providing a record of the variation in hearing levels over time. Absolute hearing levels will be much less accurate. If your disease is such that your hearing varies little over time Menieres Biometrics will be less useful: it is structured around viewing hearing variation along with various events and factors that could affect your disease. Nevertheless it may be of use as a way to keep a detailed log of relevant events, weather, and symptoms.
Disclaimer
Menieres Biometrics is NOT a medical device and is NOT intended for medical diagnosis, treatment, or monitoring of any medical condition. This app has NOT been evaluated or approved by the FDA or any other regulatory agency.
Menieres Biometrics can give a good indication of hearing level progression over time, but test results won't have the accuracy of a professional audiogram. Results will be affected by the equipment being used, external sound interference, and potentially by user error or software programming errors. Many Meniere's patients have unilateral disease and are understandably concerned about signs of bilateral disease. A professional audiogram may detect bilateral symptoms before Menieres Biometrics, so don't rule out bilateral disease based on Menieres Biometrics results. A professional audiogram uses calibrated equipment and sound-treated booths which Menieres Biometrics cannot replicate. If precise hearing measurements are needed, please see an audiologist.
CRITICAL SAFETY NOTICE: Do not use Menieres Biometrics for emergency medical decisions. If you experience sudden hearing loss or symptoms that feel outside your typical pattern, do not let any data or stable trends in this app deter you from seeking immediate medical attention from a qualified healthcare professional.
This app is provided for informational and tracking purposes only. It is not a substitute for professional medical advice, diagnosis, or treatment. Always seek the advice of your physician or other qualified health provider with any questions you may have regarding a medical condition.
Terms of Service
Effective Date: October 16, 2025
By downloading, installing, or using Menieres Biometrics, you agree to be bound by these Terms of Service ("Terms"). If you do not agree to these Terms, do not use the app.
License Grant
Menieres Biometrics LLC grants you a limited, non-exclusive, non-transferable, revocable license to use the app for personal, non-commercial purposes in accordance with these Terms.
Acceptable Use
You may use Menieres Biometrics to:
- Track your personal hearing level changes over time
- Log personal health events and symptoms
- Generate personal reports for your own reference
- Export your personal data for backup or sharing with healthcare providers
You may NOT:
- Use the app for commercial purposes or medical diagnosis
- Reverse engineer, decompile, or modify the app
- Distribute or sell the app or its components
- Use the app in violation of any applicable laws or regulations
Medical Disclaimer and Limitation of Liability
MENIERES BIOMETRICS IS PROVIDED "AS IS" WITHOUT WARRANTY OF ANY KIND, EXPRESS OR IMPLIED, INCLUDING BUT NOT LIMITED TO THE WARRANTIES OF MERCHANTABILITY, FITNESS FOR A PARTICULAR PURPOSE, AND NONINFRINGEMENT.
THE APP IS NOT A MEDICAL DEVICE AND SHOULD NOT BE USED FOR MEDICAL DIAGNOSIS, TREATMENT, OR MONITORING. THE DEVELOPERS OF MENIERES BIOMETRICS ARE NOT MEDICAL PROFESSIONALS AND THE APP DOES NOT PROVIDE MEDICAL ADVICE.
THIS APP HAS NOT BEEN EVALUATED OR APPROVED BY THE FDA OR ANY OTHER REGULATORY AGENCY.
CRITICAL SAFETY NOTICE: DO NOT USE MENIERES BIOMETRICS FOR EMERGENCY MEDICAL DECISIONS. IF YOU EXPERIENCE SUDDEN HEARING LOSS OR SYMPTOMS THAT FEEL OUTSIDE YOUR TYPICAL PATTERN, DO NOT LET ANY DATA OR STABLE TRENDS IN THIS APP DETER YOU FROM SEEKING IMMEDIATE MEDICAL ATTENTION FROM A QUALIFIED HEALTHCARE PROFESSIONAL.
IN NO EVENT SHALL MENIERES BIOMETRICS LLC (INCLUDING ITS MEMBERS AND AGENTS) BE LIABLE FOR ANY CLAIM, DAMAGES, OR OTHER LIABILITY, WHETHER IN AN ACTION OF CONTRACT, TORT, OR OTHERWISE, ARISING FROM, OUT OF, OR IN CONNECTION WITH THE APP OR THE USE OR OTHER DEALINGS IN THE APP. THIS INCLUDES, BUT IS NOT LIMITED TO, ANY MEDICAL DECISIONS MADE BASED ON APP RESULTS, DATA LOSS, OR DEVICE DAMAGE.
Indemnification
You agree to indemnify and hold harmless Menieres Biometrics LLC from any and all claims, damages, liabilities, costs, and fees (including reasonable attorney's fees) arising from your use of the app or violation of these Terms.
Termination
We reserve the right to terminate or suspend your access to the app immediately, without prior notice, for conduct that we believe violates these Terms or is harmful to other users, us, or third parties, or for any other reason at our sole discretion.
Governing Law
These Terms shall be governed by and construed in accordance with the laws of the state of Georgia, without regard to its conflict of law principles.
Dispute Resolution
Any disputes arising from these Terms shall be resolved through good faith negotiations between the parties. If a resolution cannot be reached, the dispute shall be resolved in the appropriate courts located in Georgia.
Severability
If any provision of these Terms is found to be unlawful, void, or unenforceable, that provision shall be deemed severable from these Terms and shall not affect the validity and enforceability of any remaining provisions.
Entire Agreement
These Terms constitute the entire agreement between you and Menieres Biometrics LLC regarding the use of the app and supersede all prior agreements, communications, and understandings.
Contact Information
For questions about these Terms of Service, please contact us at: [email protected]
Health Data & Privacy
Effective Date: October 16, 2025
Data Collection and Usage
Menieres Biometrics is designed to protect your privacy. The app collects and processes the following types of data:
- Audiogram Results: Frequency thresholds and timestamps
- Event Log Data: Vertigo episodes, medication changes, tinnitus levels, and user-entered notes
- User Comments: Notes and descriptions you add to events may contain personally identifiable information (PII) such as names, locations, or other personal details
- Diary entries: Subjective symptom and lifestyle factors, along with any text description you choose to enter
- Weather Samples: Local temperature, humidity, and pressure derived from approximate device location, used only for plotting and CSV export
- Device Information: Android device model, OS version (for compatibility purposes)
With the exception of device information, all data is stored locally on your device. We do not transmit, sell, or share your personal health data with third parties. You are solely responsible for the content of any PII you choose to include in event comments or diary entries.
Data Storage and Security
- Local Storage: All data is stored locally on your device using Android's standard storage mechanisms
- Automatic Backups: On most devices, Android may automatically back up app data (including hearing test results, events, and diary entries) to your Google account if system backups are enabled. Backups and restore are operated by Android/Google, not by Menieres Biometrics. You can control backup in system settings for your device or for this app.
- Manual Backups: You can export CSV files for your own records or sharing. Exported CSV files are unencrypted and beyond the app's control.
- Data Format: Data is stored in a SQLite database using Room persistence library. The app does not implement additional encryption beyond any device-level encryption you may have enabled
- No Server Storage: We do not maintain servers or databases containing your personal health information
- Export Limitations: Security protections apply only to data stored within the app. Exported CSV files are unencrypted and beyond the app's control
Data Retention
Your data remains on your device until you choose to delete it. You can delete individual test results, events, or all app data through the app's interface. When you uninstall the app, all locally stored data is removed from the device. If Android's automatic backup is enabled, copies may be stored in your Google backup and restored to new devices until you disable backup or delete the backup in your Google account settings.
Data Security Warning: Standard app uninstallation removes app data from normal access, but may not prevent forensic recovery of sensitive health information. If you plan to sell, give away, or dispose of your device, perform a factory reset and consider using secure data wiping tools to ensure complete removal of all personal data. For maximum security, physically destroy storage media.
Exported Data and Backups: When you export data or create backups, exported CSV files are saved as unencrypted files. Once exported, these files are beyond the control of Menieres Biometrics and may be shared, copied, or stored in locations with different security practices. You are responsible for securing any exported data and should consider using encryption or secure storage. Exported data includes any user-entered comments, which will be readable by anyone viewing the exported data.
Shared Devices and Multiple Users
Your hearing test results and other app data are stored privately on your device under your Android user account. If your device supports multiple user accounts (common on tablets and some phones), each Android user maintains completely separate app data. Your audiograms, events, diary entries, and settings are not visible to other Android users on the same device.
For privacy, avoid sharing your Android account credentials with others. If multiple people share the same Android user account, they will have access to all app data stored under that account, including hearing test results and any personal information entered in event comments or diary entries.
User Rights and Data Control
You have the following rights regarding your data:
- Access: View all your stored test results and events within the app
- Modification: Delete test results and edit or delete event log and diary entries
- Deletion: Remove all app data through device settings or app controls
- Data Portability: Export your data in CSV format for use in other applications
- Backup Control: Complete control over when and where to back up your data
International Compliance
- GDPR: For users in the European Union, this app processes data under the legitimate interest basis for providing the requested service. You maintain full control over your data.
- CCPA: For California residents, this app does not sell personal information. All data is stored locally on your device, giving you complete control over your data. You can view and delete your data directly through the app's interface at any time. Since Menieres Biometrics does not maintain a central database or server storage of user data, there is no separate process to request data deletion from us.
- Children's Privacy: This app is not directed to children under the age of 13. We do not knowingly collect personal information from children under 13.
Data Security Measures
- All sensitive health data is stored locally on your device
- No internet connectivity required for core functionality
- Optional, consent-based Firebase Analytics and Crashlytics are used only for anonymous usage statistics (for example, counting completed audiograms) and crash reports. They collect no test thresholds, health data, or PII.
Contact Information
For privacy-related questions or concerns, please contact us at: [email protected]
Changes to This Policy
We may update this privacy policy from time to time. The updated policy will be available within the app and will indicate the effective date.
Analytics & Crash Reporting
Menieres Biometrics uses Google Firebase Analytics to collect anonymous usage statistics and Firebase Crashlytics to collect crash reports. Together these help us improve the app and fix problems quickly. We only track minimal events, such as a count of completed audiograms. Crash reports contain only technical information (stack traces, device model, OS version, app version). We do not collect your test thresholds, event notes, or any personally identifiable information (PII).
Consent and regional defaults
Analytics is opt-in for users in the European Economic Area (EEA), United Kingdom, and Switzerland. For other regions (for example, the United States), analytics may be enabled by default. In all cases, you remain in control and can change your choice at any time from the Settings screen.
What is sent
- Minimal usage events (for example, audiogram completed)
- Crash reports: stack traces, device model, OS version, and app version
- Device-level metadata required by Firebase (for example, app version) for aggregate reporting
- Not sent: audiogram threshold values, event log contents, diary notes, names, locations, or any PII that you may enter elsewhere in the app
Advertising signals
Menieres Biometrics does not show ads. We do not enable ad personalization, and we deny ad personalization and ad user data consent in Firebase Analytics.
How to change your choice
Open the Settings screen and toggle Share anonymous usage statistics and crash reports on or off. Changes take effect immediately. When disabled, no analytics events or crash reports are sent.
Safety
Having hearing loss doesn't mean your ears are immune to damage from loud sounds. Please be careful while running a test not to expose your ears to excessive sound levels. This could happen, for example, with faulty audio connections. It could also happen if you have severe hearing loss at certain frequencies. The sound level required for you to hear those frequencies might be loud enough to damage your ears. There's no way for Menieres Biometrics to know if this is the case with your ears or your audio equipment, so please use your judgment and safeguard your hearing.
Avoid leaving sound on for extended periods. In particular, be careful not to fall asleep during a test! If a loud tone is playing it could continue playing, potentially damaging your hearing. The app should stop playing sound after a few minutes, or when the phone goes idle, but these safety measures shouldn't be your first-line defense against exposing your ears to excessive sound levels, or to any sound levels for an extended period.
Test accuracy
The most important measurement provided by Menieres Biometrics is the change in hearing level over time. Results produced by the app have the potential to be quite accurate in this regard. Results will depend in large part on the equipment being used: see the section on Equipment for a discussion of what headsets, etc. will be likely to produce more accurate results. Even with excellent equipment, however, the absolute accuracy of any one test will not match that produced by an audiologist. The equipment used by audiologists in the U.S. must generally meet stringent accuracy requirements set by OSHA and ANSI (other countries have their own requirements). Furthermore, the equipment must undergo extensive annual calibration, with some checks being performed weekly or daily. Menieres Biometrics, lacking such precise equipment and calibration, will necessarily be less accurate. Depending on hardware details of your headset and android device, the accuracy may be particularly poor for low volume sounds. This means your hearing could decline some before the app measures any decline at all. Exactly how much is hardware dependent. This means you shouldn't use app results to rule out bilateral disease -- some decline may occur before being evident in Menieres Biometrics results.
The hearing levels measured by Menieres Biometrics are uncalibrated. You can set a calibration offset to make Menieres Biometrics results more closely match audiologist results. No frequency-dependent calibration is provided, so the overall shape of your audiograms will depend on how flat the frequency response of your equipment is.
Accuracy summary:
- Hearing level changes over time: can be quite accurate, though with potentially substantial inaccuracy at low sound levels (near normal hearing).
- Absolute accuracy: heavily dependent on equipment, so accuracy may be poor. Some correction possible by setting the calibration offset.
- Audiogram shape: potentially good, though very dependent on equipment.
For reasonable equipment you should be able to produce audiograms that are sufficiently accurate to provide meaningful trends analysis on the Trends tab. Determining absolute hearing loss requires an audiologist.
The Analyze audio menu item can give you a hardware-specific indication of how well your particular phone and connected headset support hearing tests, in particular for low-level hearing loss. It reports the audio bit depth of the active output device and whether any audio effects are active, and summarises the findings at the top of the dialog. Note that the report covers the current audio device, so connect the headphones or other audio device you'll be using for a hearing test before analyzing your audio.
Getting started
To get the best test results requires a good audio headset. Please read the Equipment section. If this is the first time you've used Menieres Biometrics you may want to test it with whatever earbuds or headphones you already have. If you already have good headphones, you're all set. If you are testing with sub-optimal equipment, that is fine for learning what Menieres Biometrics does, but you are strongly encouraged to get more ideal equipment quickly. The reason is simple: the key output of Menieres Biometrics is a record of how your hearing has changed over time. Different headsets may differ in amplitude response by a surprisingly large amount, so switching equipment will corrupt the trends plot -- it will be displaying the change in the frequency/amplitude response of your headsets rather than changes in your hearing. Consistency is crucial, so as soon as possible you should select a good headset and use that for all subsequent tests.
The main Menieres Biometrics screen has five tabs: Test, Results, Events, Diary, and Trends. In normal use you would go to the Test tab and take an audiogram on a frequent basis (daily is recommended). You can then go to the Results tab to view the test results. On the Events tab you can enter any events you want to record, including vertigo episodes, tinnitus changes, and medication changes. The Diary tab allows you to track symptoms, lifestyle factors, and other data that may help identify patterns and triggers. Lastly, on the Trends tab you can view changes in your hearing over time, and observe correlations with logged events, diary data, and weather. If you're just getting started with Menieres Biometrics your ability to see the functionality of the different tabs will be limited: there will be no test results or events to view on any of the tabs. So to get started, the first thing to do is to record an audiogram. See How to run an audiogram for a description of how to take and store an audiogram.
After completing an audiogram, you can go to the Results tab to view it. You can also start entering events on the Events tab, but normally you would only enter events as they happen. For example you would add an event for a vertigo attack, though presumably after the attack has passed. If you kept a record elsewhere of when you had vertigo, or started or stopped medication, etc., you can enter those in the Events log too.
After you've taken several audiograms you can go to the Trends tab and view hearing changes over time. This generally won't be very informative until you've been taking audiograms for an extended period, perhaps a month or more, depending on characteristics of your particular hearing progression.
Onboarding
The onboarding screens provide a quick tour of Menieres Biometrics when you first start using the app. You can also access them anytime from the main menu: tap the menu button (three horizontal lines) in the top-right corner and choose Show onboarding.
Each onboarding card explains a key feature of the app and includes a link to the relevant section of this help file for more details. You can navigate between cards using the Back and Next buttons, or close onboarding at any time with the × button in the top-right corner.
Context-Sensitive Help
Each tab includes a Help button (question mark icon) in the bottom-right corner that provides contextual help based on the current state of the app. The help text adapts to what you're currently doing, so you get relevant guidance for your specific situation.
Tap the Help button to see tips tailored to the current tab and its contents. For example, on the Results tab you'll get help about viewing audiograms when you have data, or guidance on taking your first test when you don't. The help dialog can be dismissed by tapping outside of it or using the close button.
Equipment
The only equipment required (other than an Android phone) is a good headset for playing sounds. For obvious reasons a phone's built-in speaker is inappropriate for hearing tests. While earbuds are usable, a proper over-the-ear headset is recommended. These are sometimes called "circumaural" or "around-ear". Furthermore, it is best to avoid Bluetooth connections or headsets with noise-cancellation features unless the noise cancellation can be fully disabled. The goal; is to provide high quality sound and very consistent test-to-test repeatability. Earbuds may provide high quality sound, but might be more prone to amplitude variation based on the exact placement of the earbud in the ear. So one test may read higher or lower than other tests simply due to minor differences in earbud placement. Some Bluetooth earbuds or headsets may be perfectly adequate, but a little extra caution may be necessary. Bluetooth audio equipment often includes additional processing that could degrade accuracy in a pure-tone test such as an audiogram. Menieres Biometrics will issue a warning when a test is started with Bluetooth (unwired) audio. This warning message can be suppressed in app settings.
Philips SHP 9600 headphones are an example over-the-ear design (this isn't an endorsement and we don't receive a commission for this mention). This headset uses an "open back" design, which doesn't isolate external sounds, so a quiet environment is necessary. A "closed-back" design would be more appropriate if you don't have a quiet place to take audiograms. Furthermore, if one ear is far better than the other, an open back design may allow your good ear to hear the tones intended for your other ear, making proper threshold determination difficult. Audiologists often use noise masking for this (playing noise in the opposite ear). Menieres Biometrics doesn't currently have the capability to apply noise masking. In short, an open back design may provide better sound quality but allows external noise. A closed-back design provides better isolation from external sounds. Depending on design, earbuds may also offer good isolation.
For best results you should use headphones with a flat frequency response. This means that all frequencies are played with approximately equal amplitude. So you should avoid headphones that have features such as "bass boost" or other sound modifications. In general, headphones that are labelled "studio monitor" or "studio reference" will have a flatter response.
If you wear hearing aids, remove them prior to taking a hearing test. Do not use the hearing aids in place of a good headset, even if your aids link to your phone: the aids will vary in volume and frequency response such that results will vary with hearing aid settings, making analysis of hearing trends difficult or impossible.
Whenever you change your headset or earbuds, enter an "Equipment change" event to indicate the change. This will allow the Adjust for equipment change feature (in the Trends tab) to adjust the audiograms for the change. This is an inexact adjustment, but can help smooth the differences caused by changing equipment.
Note that the standard 3.5mm headphone jack is becoming much less common on phones, but is still common on headsets, so you will likely need to use a USB-C to 3.5mm converter. This of course won't be needed if your headset has a USB connector, or other connector that fits your phone. For the best audiogram accuracy try to get a 24-bit adapter. A 16-bit adapter will limit low-volume tests, limiting test accuracy for small hearing losses. The Apple-branded adapter is 24-bit and is fairly inexpensive (about US$10).
One last concern: very high quality headsets often have lower sensitivity, or higher impedance, than lower quality headsets. This means they require more signal amplification to produce a given sound level. The result is that some headsets would have trouble producing sounds loud enough to measure higher levels of hearing loss. For example, if you have substantial hearing loss, perhaps 60 to 80 dB or more, at a given frequency a high impedance / low sensitivity headset may be unable to produce a sound loud enough for you to hear, rendering the audiogram invalid at that frequency. So it is advisable to test a headset before purchase, or to buy a headset that can be returned if it proves to be inadequate. As a general rule, if a headset can play music on your phone at a level that a listener with normal hearing would consider to be fairly loud, the headset is likely to be usable for audiograms.
Tab screens
The app consists of five tabs:
- Test: Performs hearing tests (audiograms).
- Results: Provides a list of stored audiograms; plots selected results.
- Events: Provides a way to log vertigo attacks, medication changes, and other relevant events.
- Diary: Track symptoms, lifestyle factors, and other subjective data that may correlate with your condition.
- Trends: Provides a plot summarizing hearing levels and events.
Test Tab
The test tab is where you generate audiograms. Audiograms are self-administered: upon starting an audiogram you will step through the different frequencies, adjusting the volume and hitting Set Threshold at the minimum detectable volume. After finding the threshold for all frequencies and both ears you will normally save the results and perhaps create a backup copy.
Taking an audiogram, short description
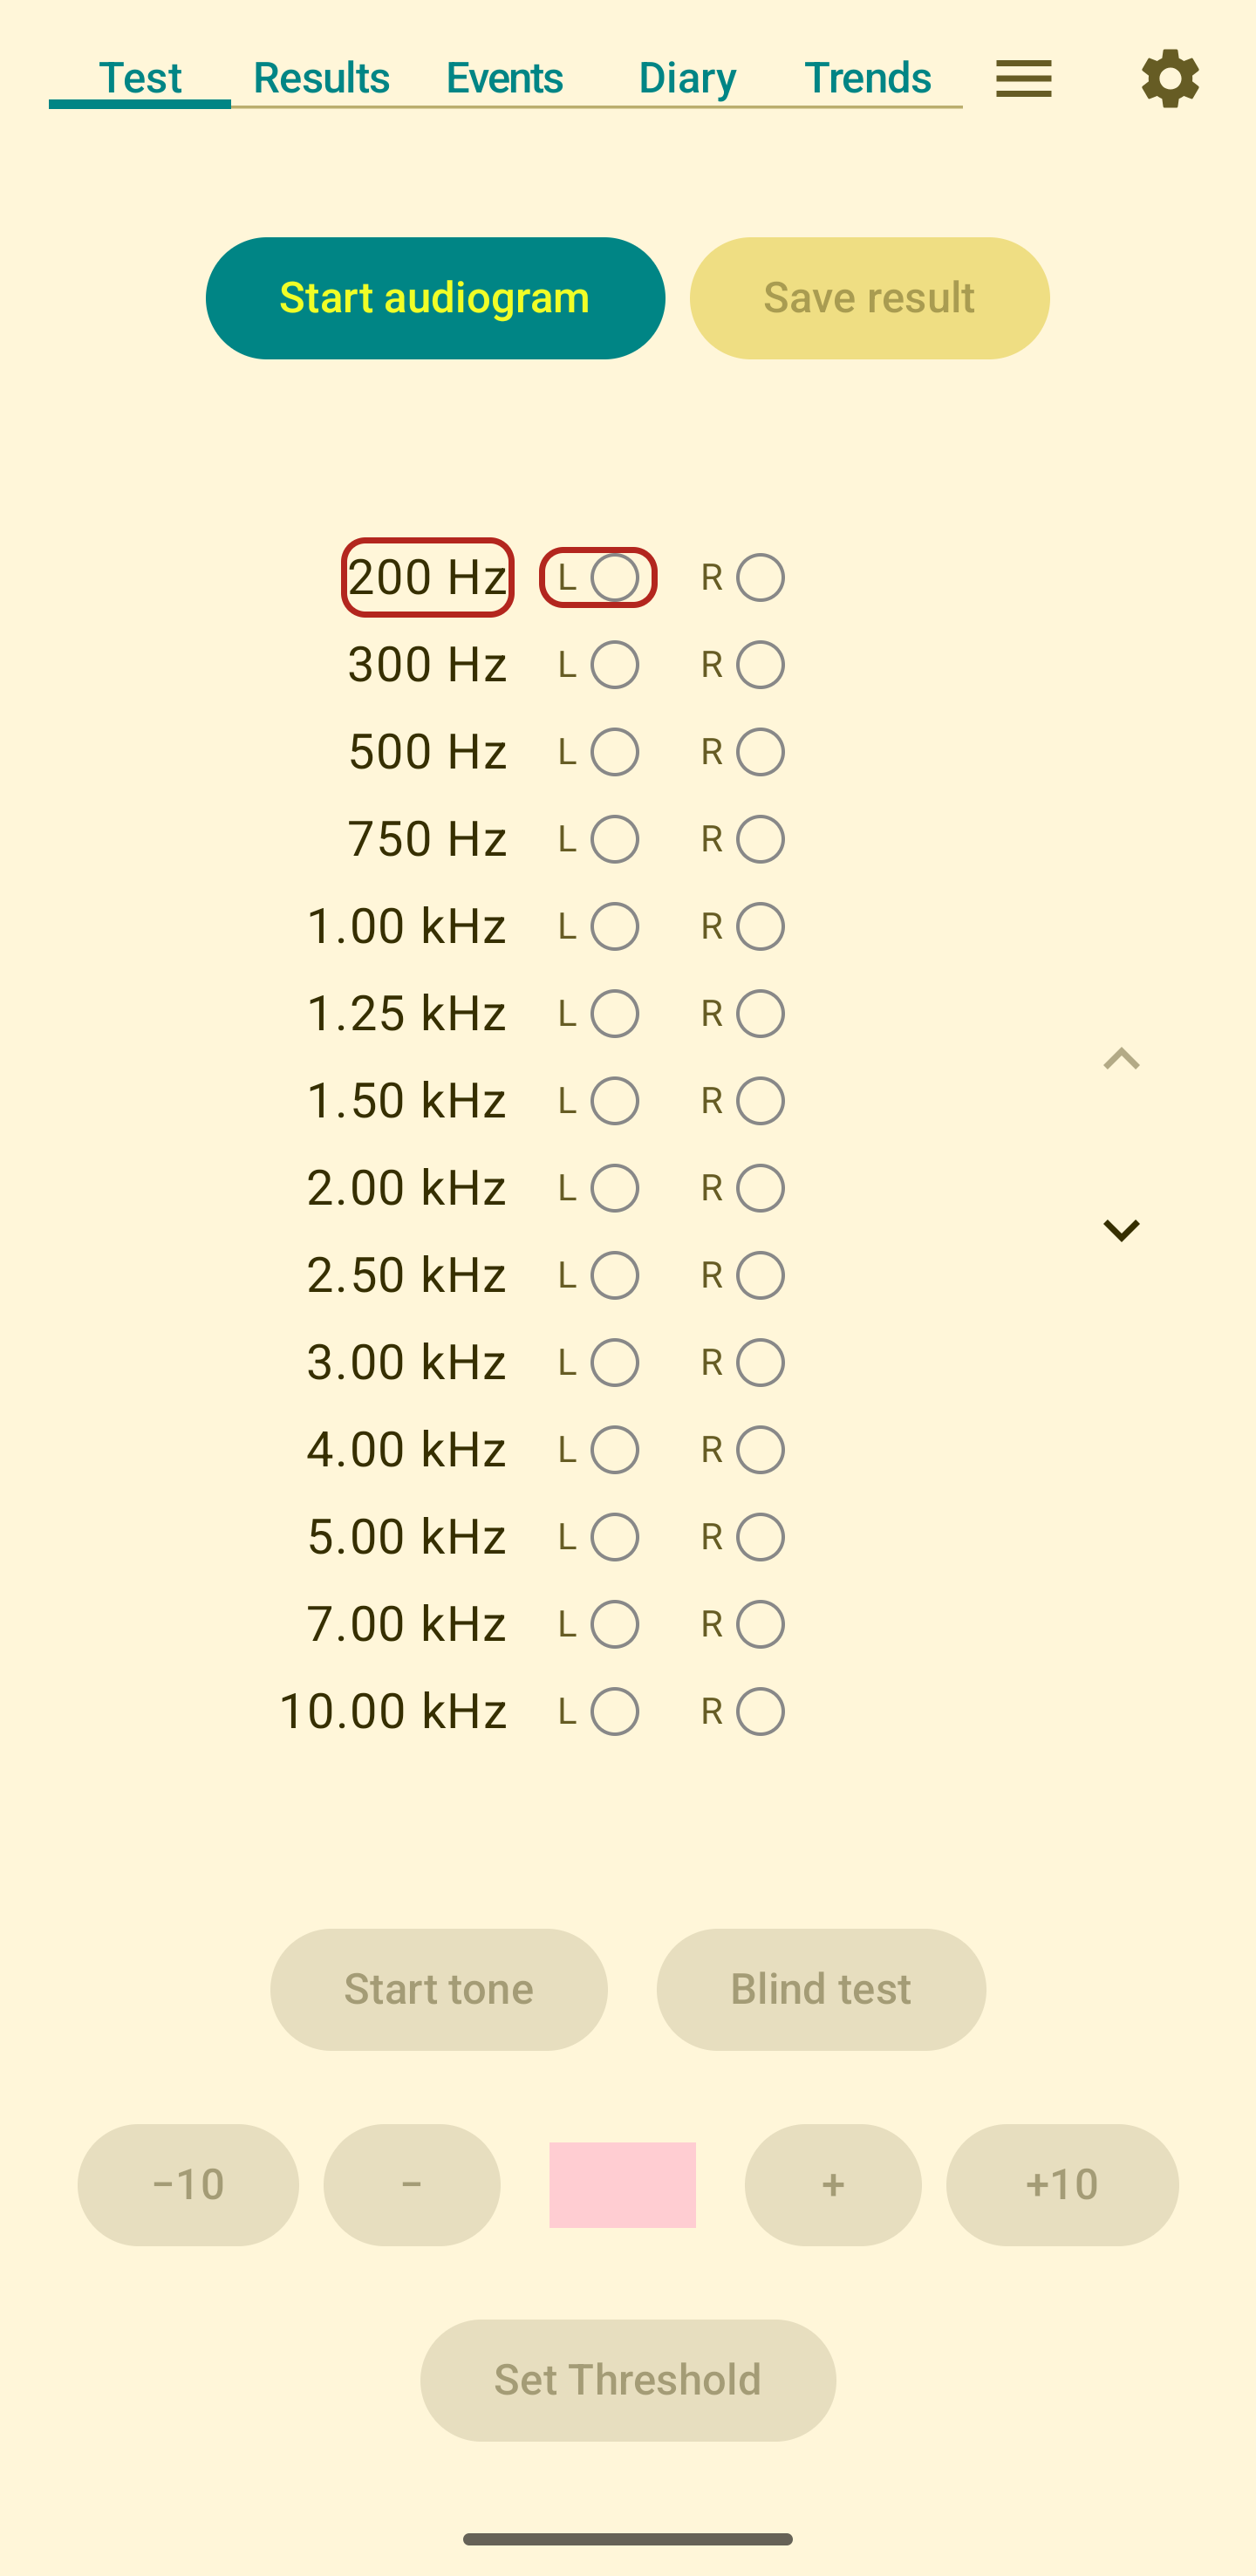
First choose between a full audiogram (testing all standard frequencies) or a short audiogram (testing only key frequencies). The short audiogram tests fewer frequencies and takes less time, while still providing useful tracking data. Then click Start audiogram, and respond to any messages that appear. Then adjust the volume using the + and - buttons until the sound is just barely audible. Do not adjust the sound using your phone's volume control. You may want to hit +10 or -10 for more rapid adjustment. In particular, your first test will start at a very low volume, possibly requiring multiple +10 presses to get to an audible level. When the signal is just barely audible, hit Set Threshold, which will store that threshold and advance to the next frequency and ear. When you complete the final threshold, the test is automatically saved and you'll be taken to the Results tab to view your audiogram.
Taking an audiogram, detailed description
To start a new audiogram, first choose between a full audiogram (testing all standard frequencies) or a short audiogram (testing only key frequencies). The short audiogram tests fewer frequencies and takes less time, while still providing useful tracking data. Then press the Start audiogram button. This will usually produce a popup screen requesting that the phone's audio volume be set to its maximum. This is necessary to provide consistent sound levels from one test to the next. The app adjusts the sound level during a test by varying the tone amplitude, not by adjusting the system volume. After a test is complete the system volume will be set to its prior level. The popup screen can set the volume to the maximum level for you. You may also get a warning message if you're using a headset that may be deficient, for example if you're using the system speaker. You can continue the test, but accuracy may be poor. Once you've set the volume, you can continue with the test. For each frequency and ear you should adjust the sound level by hitting the + and - buttons. The goal is to adjust the volume so that the given tone is just barely audible. When you have adjusted the volume to the just-audible level, press Set Threshold. To avoid sudden loud sounds, for the very first test the volume will be set to a low level. You will likely need to hit the +10 button several times before hearing any sound. In subsequent tests, the volume automatically starts 5-10 dB above your last threshold for that frequency and ear. This starting point helps you quickly find the new threshold while avoiding sudden loud sounds. The small random offset prevents you from being biased by previous tests.
Pressing Set Threshold sets the threshold for the given ear and frequency. Later you can view audiogram results on the Results tab, but data for a test won't be available until an audiogram is completed and saved. Upon hitting Set Threshold the test will advance to the next ear or frequency. You may notice that after pressing Set Threshold the button is immediately disabled. This prevents an inadvertent double-press, which would set the threshold for both the intended ear/frequency and for the subsequent (unintended) one. Hitting any of the volume adjustment buttons will re-enable the Set Threshold button.
If you mistakenly hit Set Threshold before intending to, you can use the arrow buttons to the right of the frequency list to move back to the erroneous test. You can then continue as before: adjust the volume and tap Set Threshold.
Upon hitting Start audiogram you'll see that the Start tone button is now labeled Stop tone. This button turns on and off the tone temporarily -- it doesn't halt a test. It is common to press Start and Stop multiple times during a test, to help you determine if you're actually hearing the test tone, rather than mistaking tinnitus for the tone. When in the stopped state the volume buttons are disabled.
The Blind test button allows you to do a blind test of the current tone and volume. It will randomly turn the tone on or off and ask you to indicate whether or not you think the tone is on. It then shows if you correctly detected the on/off state. The test repeats automatically until you hit Close. If you are often incorrect, then you may have the volume below your true hearing threshold. If it's extremely easy to tell if the sound is on or off, then you probably have the volume too high. Note that this is just to help you set the threshold for the current frequency and ear. It doesn't change the tone volume or adjust thresholds, and it doesn't affect the general test process. Furthermore it isn't a required part of testing -- you can run a full test without ever using the blind test.
If you are using a physical keyboard, you can answer blind test questions without touching the screen: press Y if you heard the tone, N if you did not, or Q to close the blind test and return to the main test screen.
As you proceed through the individual frequencies the "L" and "R" markers for the completed frequencies will be marked and the current frequency will be highlighted.
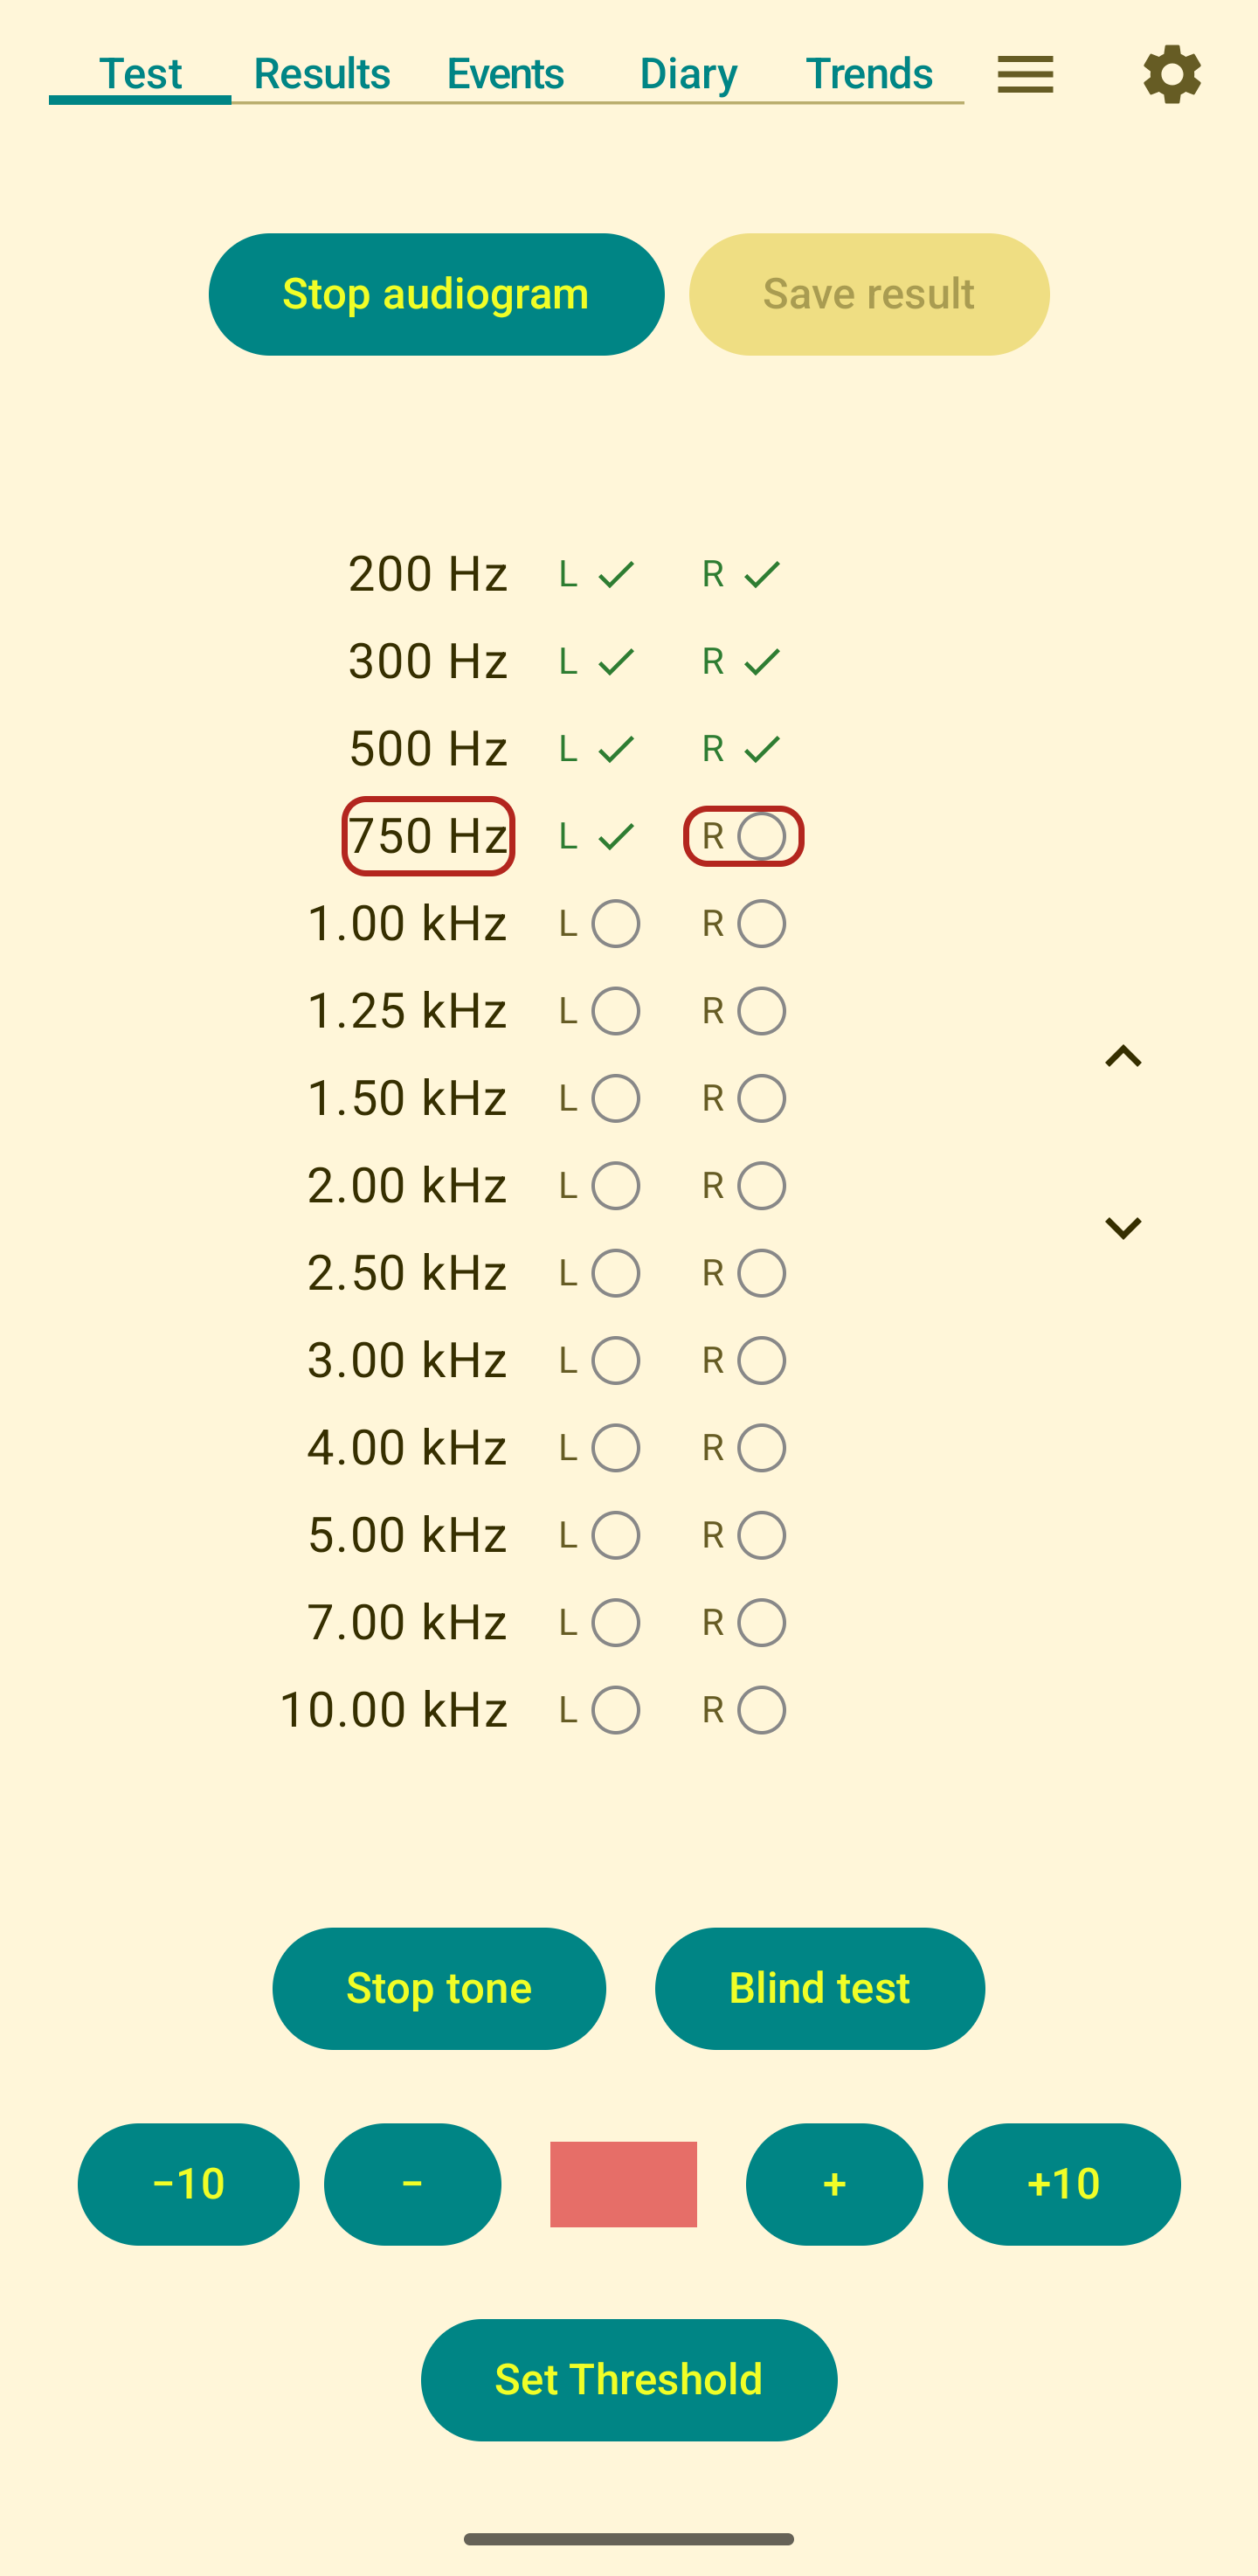
Between the - and + buttons there is a volume indicator displayed as a simple red shaded box, where the intensity changes with changes in volume. The red indicator will flash briefly when you press the volume adjustment buttons, providing visual feedback that the volume has changed. This should give you some indication of the varying volume without biasing your threshold determination.
When you complete an audiogram (after setting all frequency/ear combination thresholds), the test is automatically saved and you'll be taken to the Results tab to view your audiogram. If you need to make corrections before the test is complete, you can go back to any frequency/ear combination and set the threshold properly. Once all thresholds are set, the test saves automatically.
Once you have saved an audiogram there is no way to edit it. You can delete it and re-run an entire audiogram, but there's no way to edit just a frequency or two. Normally there should be no need to edit audiograms. As mentioned above, if you know an individual threshold was improperly set, you can modify it prior to saving the audiogram. Once you've saved it, editing is no longer possible.
After saving the audiogram you may be prompted to save a complete backup (of all tests and events) based on the backup setting you've selected in the Settings screen. If the backup location you specify is on your device, you'll get a warning message that reminds you that off-device (i.e. cloud) storage is generally wiser, providing a backup in case your device is lost, stolen, or disabled. Note that off-device storage security is up to you: only back your data up to storage that includes security you're comfortable with.
See Accuracy for a discussion of the accuracy you can expect from the audiogram.
Keyboard shortcuts
If you are using a physical keyboard (for example, a Bluetooth keyboard paired to your phone), you can perform a complete audiogram without touching the screen. This is particularly useful for users who rely on a keyboard rather than touch navigation.
Note: screen readers (e.g. TalkBack) are not compatible with the audiogram test. Because the media volume is set to maximum during a test, screen reader speech would play at full volume through your headphones, which could cause hearing damage and will interfere with threshold determination. If you use a screen reader, disable it before starting a test and use the keyboard shortcuts below instead.
| Key | Action |
|---|---|
| Space | Start / Stop tone |
| Enter | Set Threshold |
| B | Blind test (randomly plays or mutes tone) |
| Y | Blind test: answer “Yes, I heard the tone” |
| N | Blind test: answer “No, I did not hear the tone” |
| Q | Blind test: close and return to main test screen |
| → or = | Increase volume (1 step) |
| ← or − | Decrease volume (1 step) |
| ↑ | Increase volume (10 steps) |
| ↓ | Decrease volume (10 steps) |
| PageUp or [ | Go to previous frequency / ear |
| PageDown or ] | Go to next frequency / ear |
When all frequencies have been tested the media volume will also be automatically restored to its level before the test began.
Results Tab
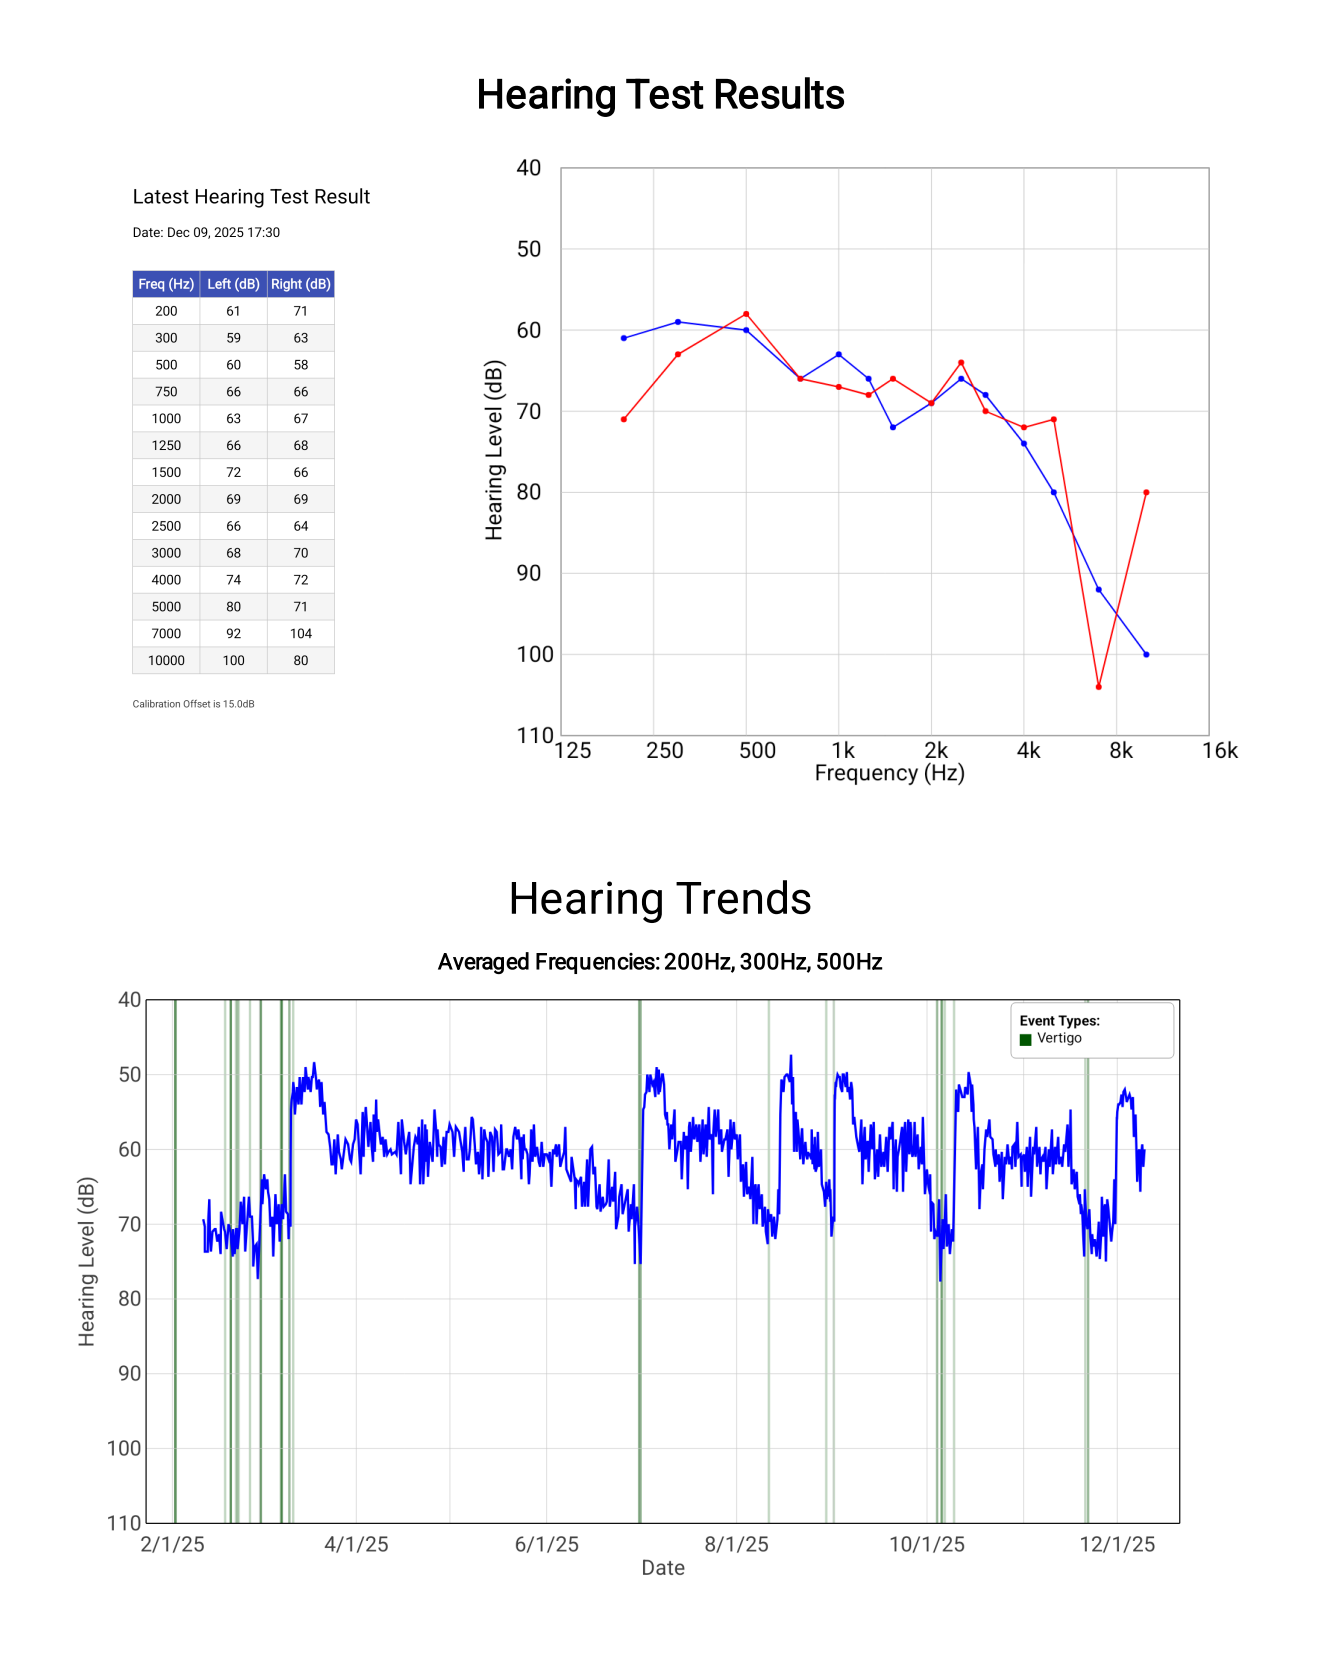
The results tab allows you to view stored audiograms. After you've recorded one or more audiograms you'll see a list of past results, ordered by date and organized by month. Tapping an item in this list will produce a plot of the corresponding audiogram. Following standard audiogram convention, the left ear threshold is plotted in blue and the right ear is plotted in red. Note that the scale of the plot -- i.e. the minimum and maximum hearing thresholds plotted -- will be fairly large by default. Double-tapping the plot produces a dialog that allows you to specify a desired y-axis range.
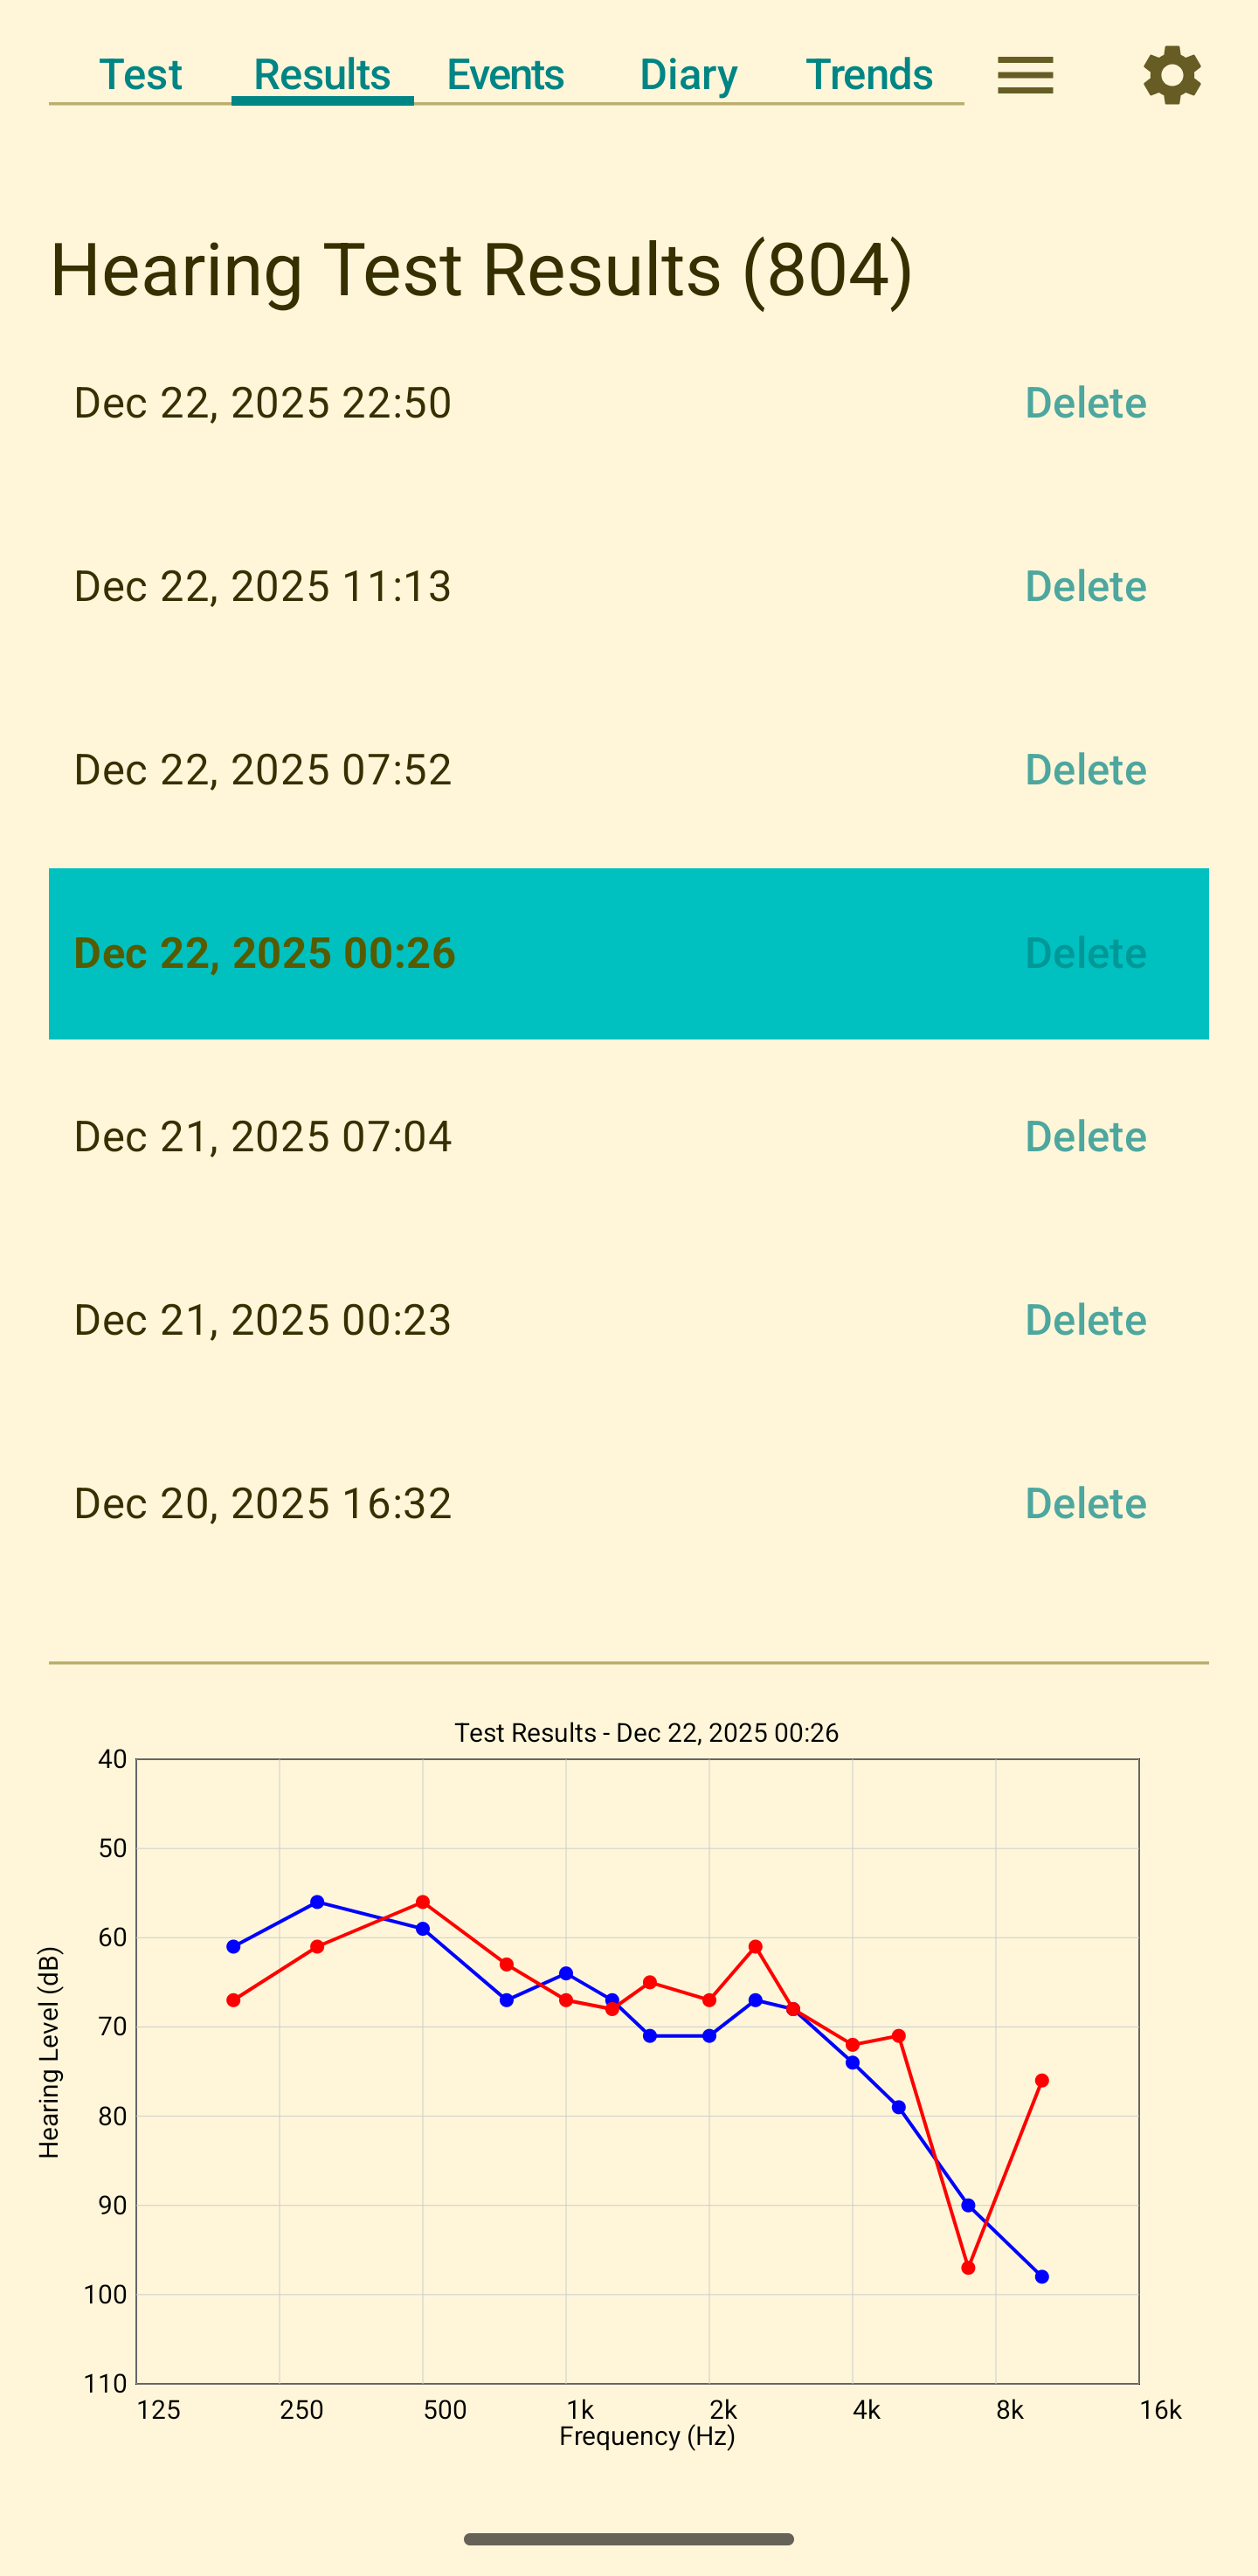
If you've entered any events on the events tab, you may see small circle indicators next to some of the results on the results tab. These markers correspond to events, and are color-coded to match the event colors used in the trends tab. Markers will appear next to the first audiogram following an event. This allows you to see the first audiogram after vertigo or other logged events. A long-press on the colored circles will produce a pop-up description of the corresponding events.
The number in parentheses after the "Hearing Test Results" title is the total number of stored audiograms.
Events Tab
The Events tab provides a log where you can record events that may be relevant to your disease progression. These events can later be displayed in the Trends plot. The following event types are supported:
- Vertigo
- Roaring sounds
- Medication change
- Symptom flareup
- Illness/Allergies
- Equipment change
- Doctor visit
- Drop attack
- Headache
- Trigger
- Other
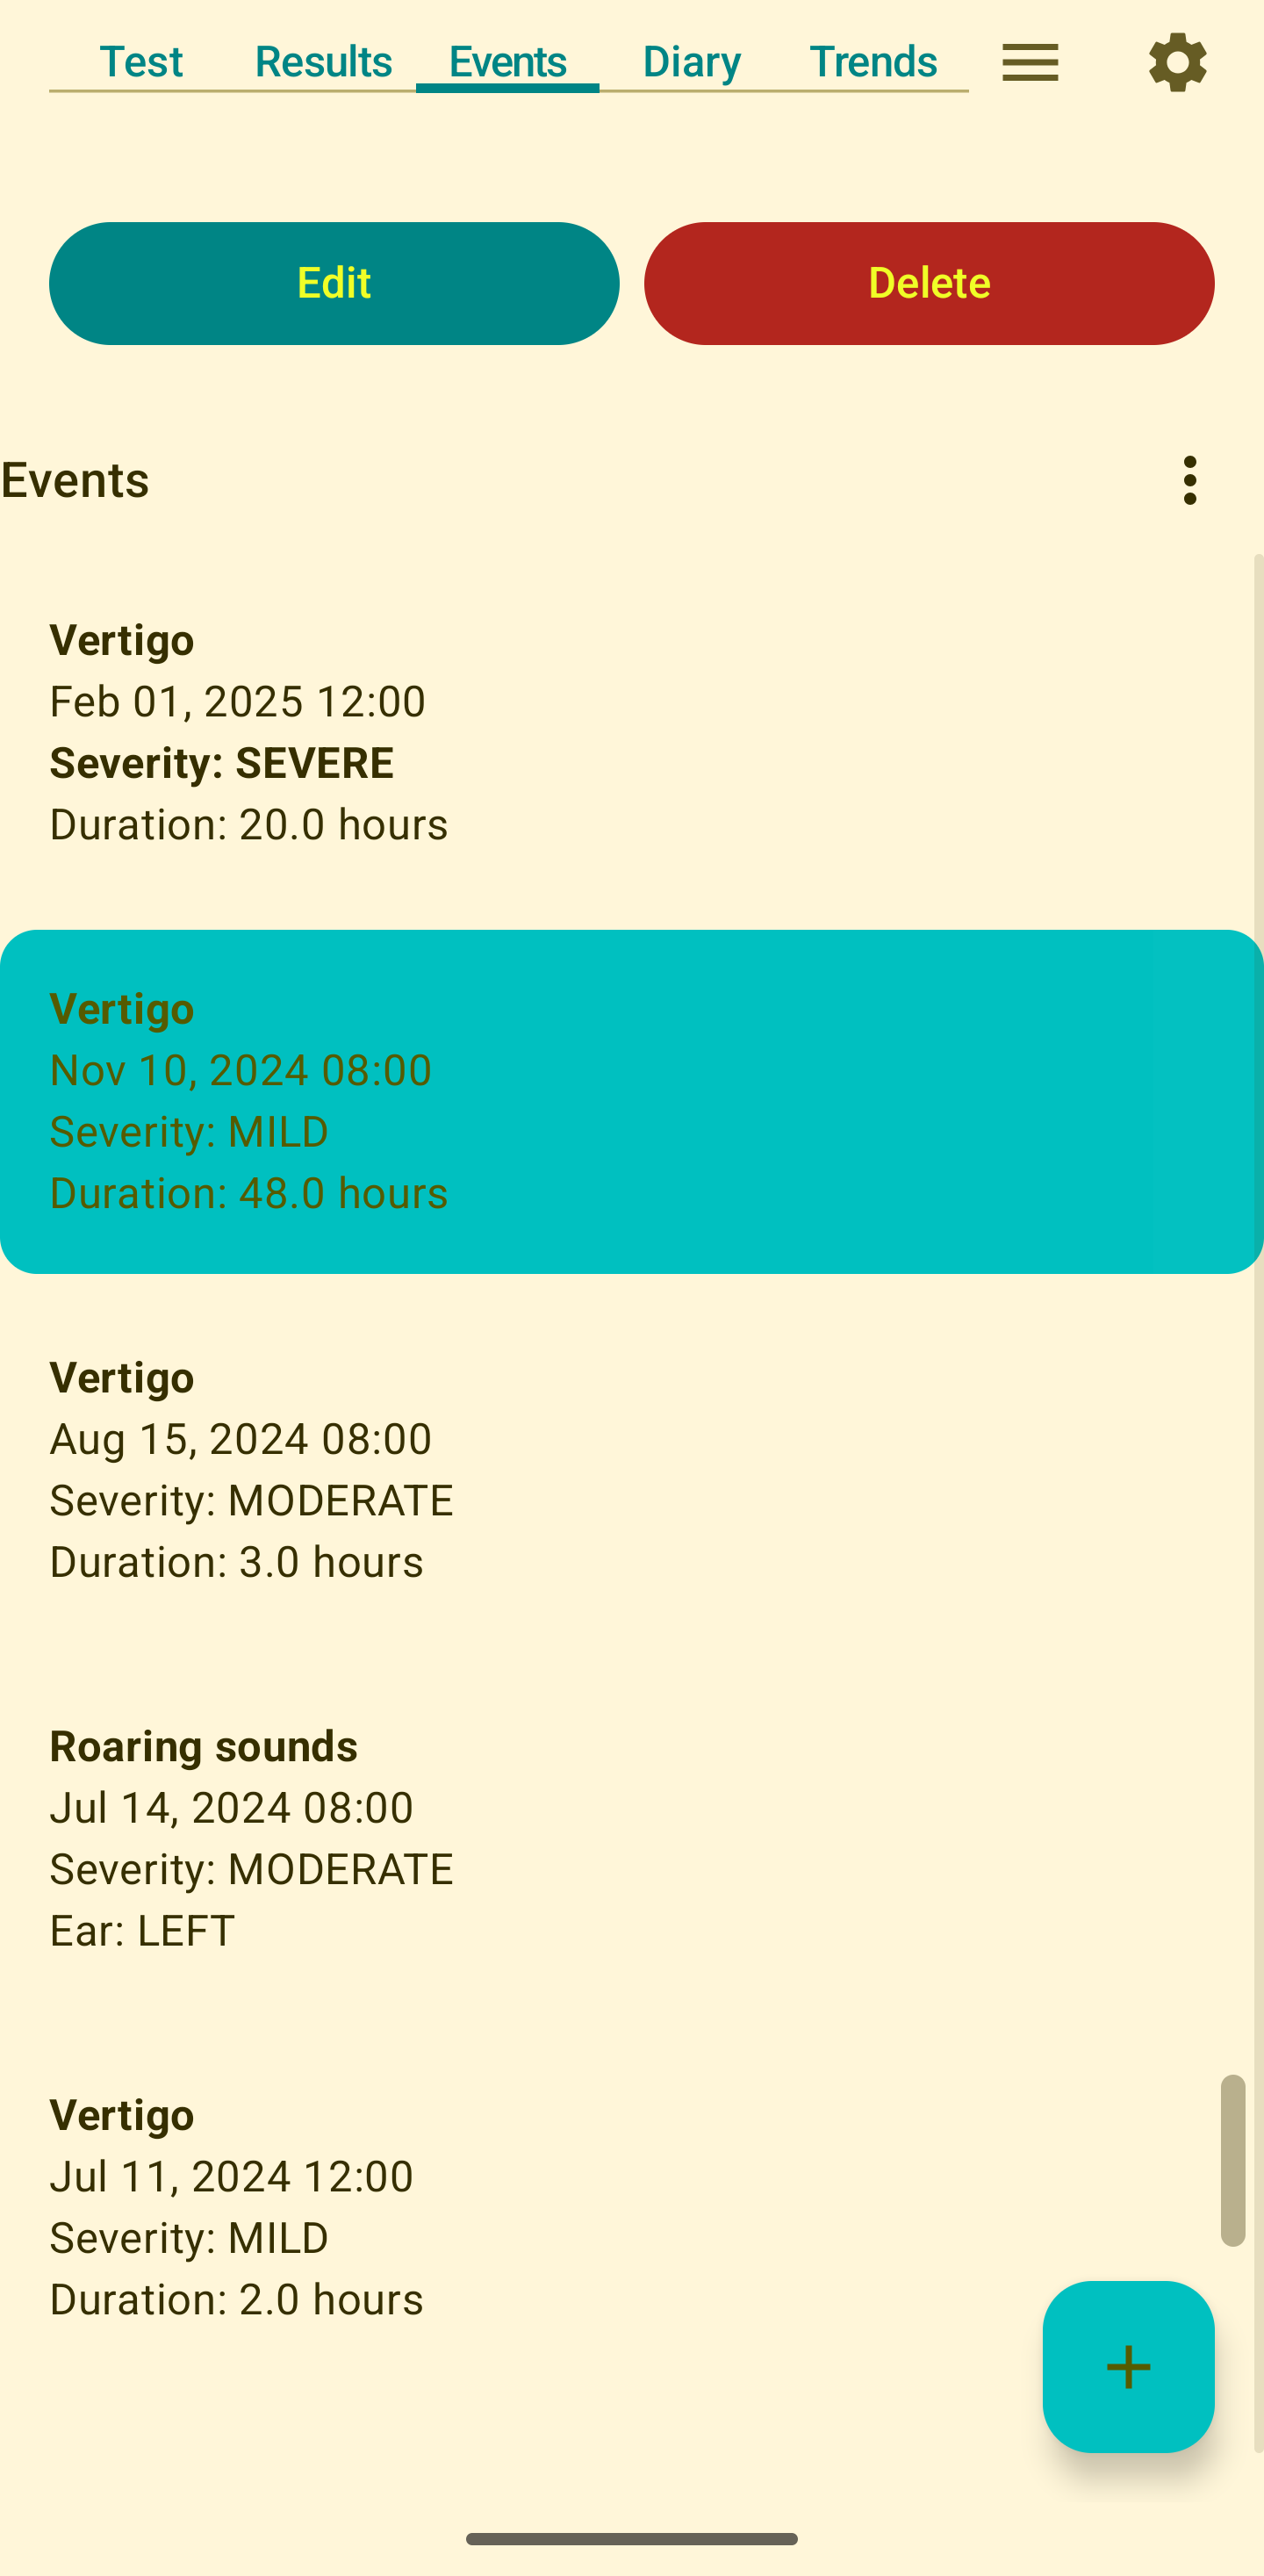
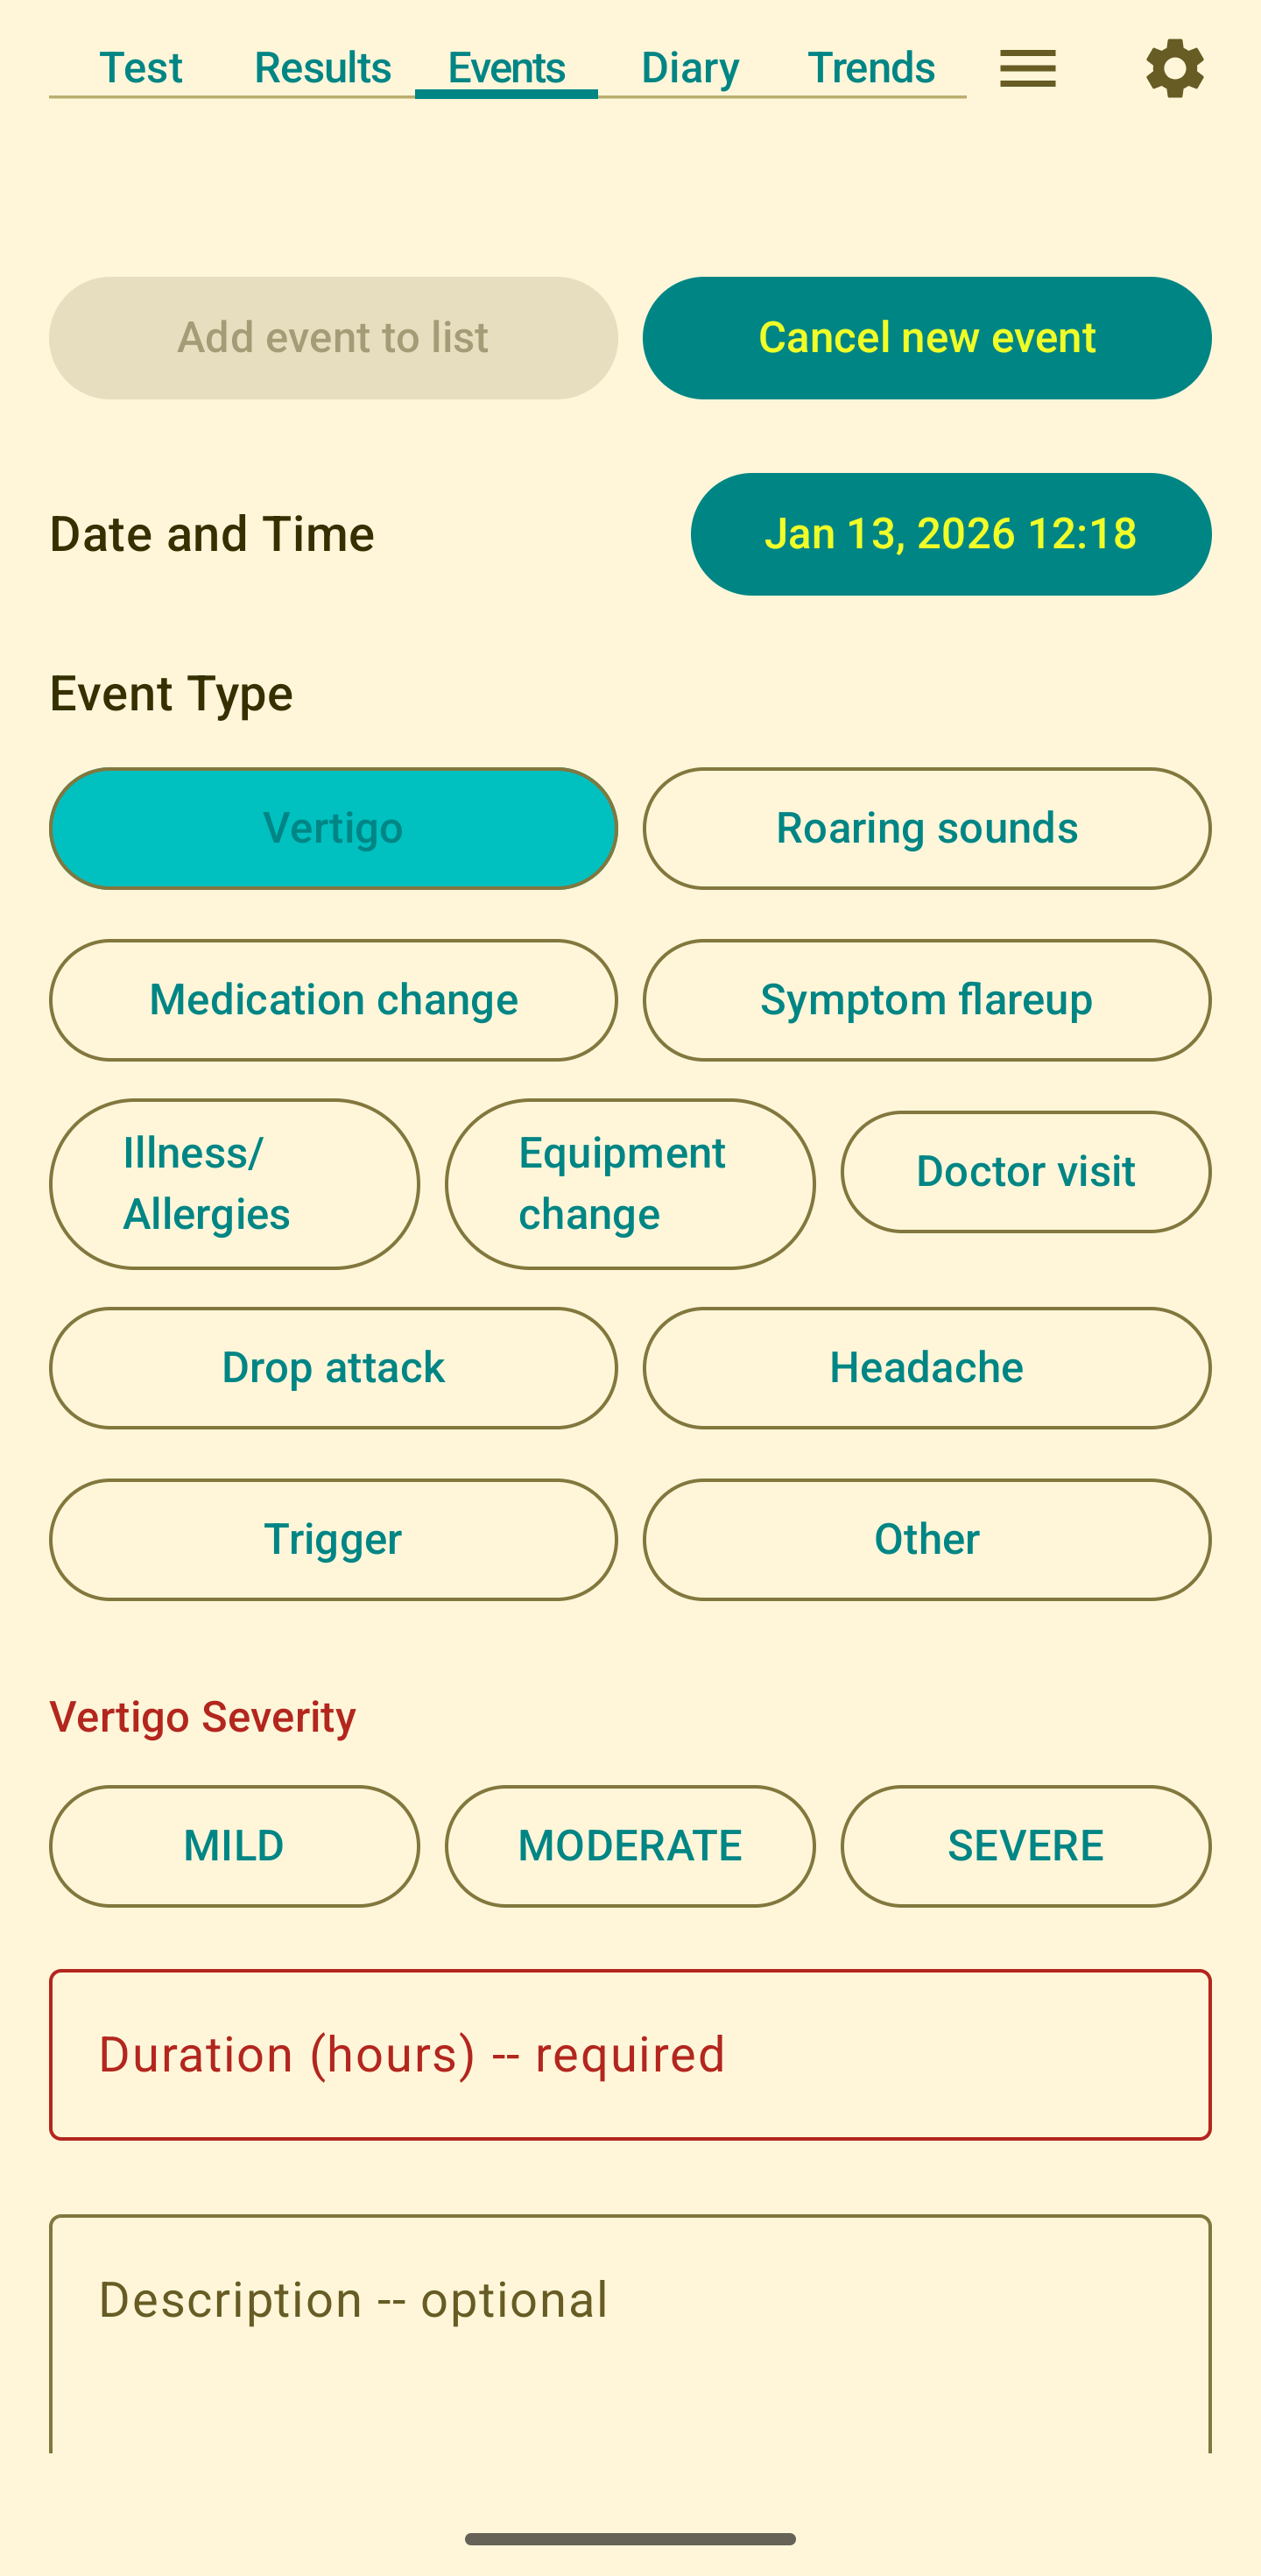
To add an event, press the + button at the bottom of the screen. You can then indicate the date of the event by pressing the date and time button. Then indicate the event type by pressing the corresponding event button. This will produce additional input fields based on the selected event type. For example, if Vertigo is selected you'll be prompted to enter the severity and duration of the vertigo. For most event types you'll also have a comment field where you can include any additional information you want to record with the event. Comments are limited to 400 characters. After setting the event information, tapping Add event to list will store that event. Note that Add event to list will be disabled until all necessary fields have been filled in. After tapping Add event to list the event should be visible in the events list. Selecting the event in the list will allow you to edit or delete the event.
There is a subjective aspect to defining the events, particularly those related to symptoms. For most of these events the precise definition is up to you: enter events under whatever label you feel is most appropriate.
Note that there is no separate event for tinnitus. For most Meniere's patients tinnitus never goes away, so there is no discrete event that needs to be recorded. Tinnitus does sometimes change substantially, for example it may at times become much louder than normal. This could be recorded as a Roaring event, or a Symptom flareup event, based on your preference. Hint: in the Events tab you can filter events based on event comments. So, for example, you could enter a tinnitus change as a Symptom flareup event and include a comment with the event such as Unusual tinnitus. Then when displaying the trends plot you could filter on tinnitus to see only the events that mention tinnitus.
Diary Tab
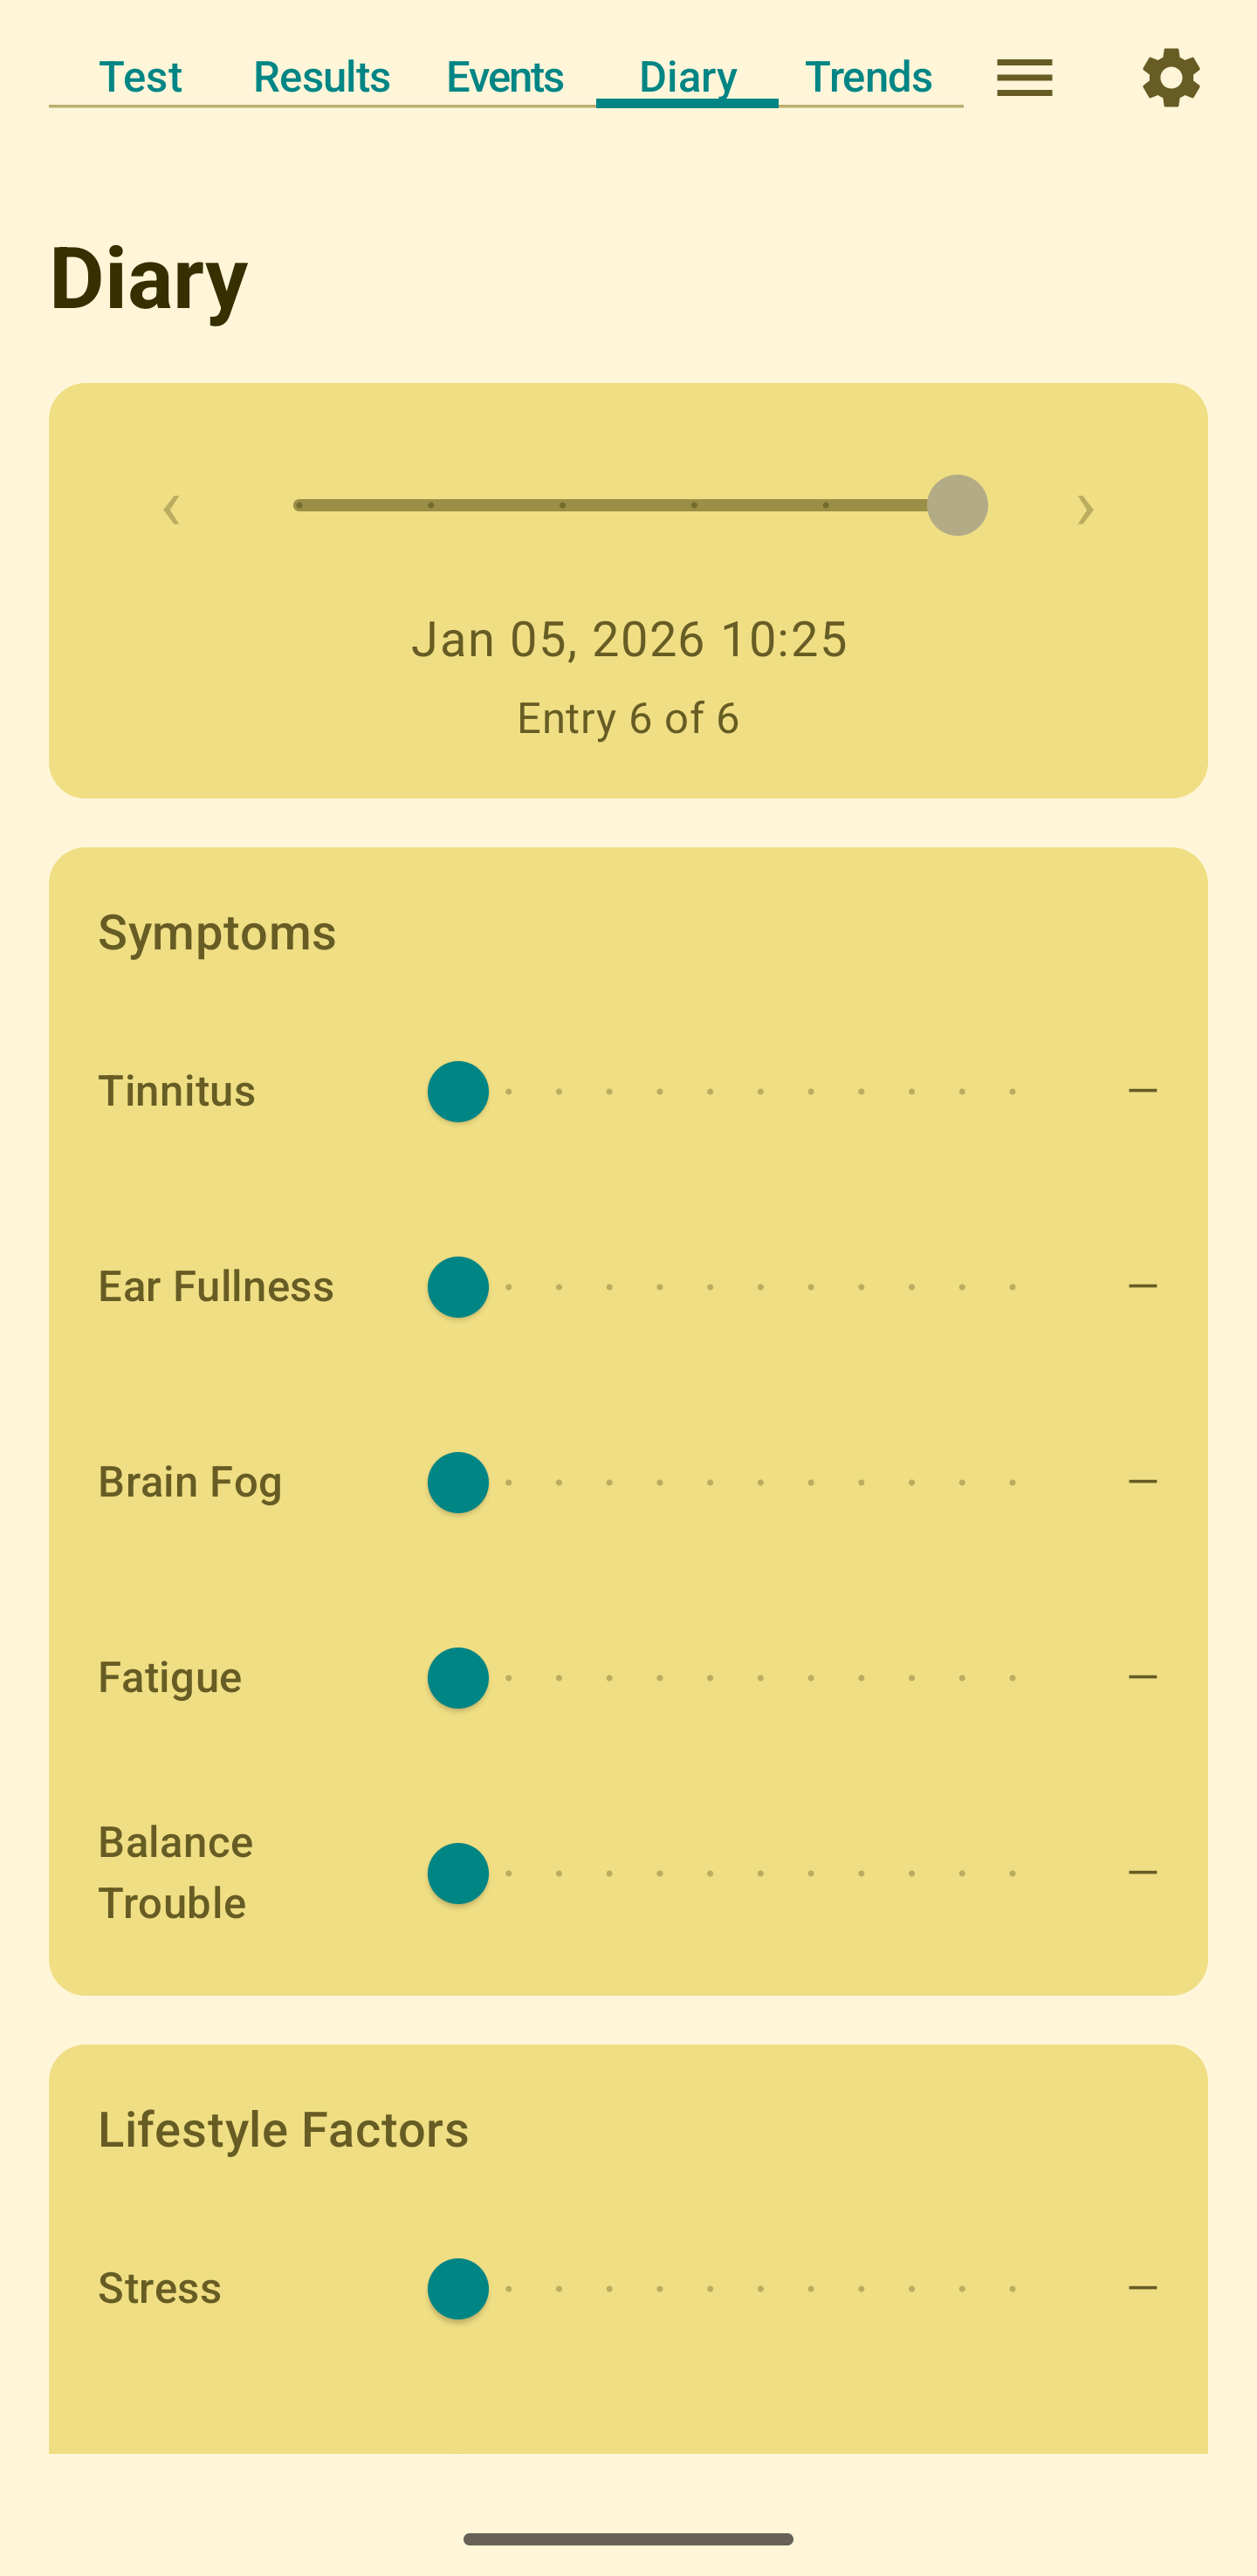
The Diary tab provides a way to track symptoms, lifestyle factors, and other subjective data that may correlate with your Meniere's condition. This data can help identify patterns and triggers that affect your symptoms, complementing the objective hearing measurements from audiograms. You can also enter a simple text description to keep a record of anything you think is notable for the day.
Use the Diary tab to log daily information such as:
- Symptoms: Tinnitus, ear fullness, brain fog, balance issues, fatigue
- Dietary triggers: Caffeine and sodium
- Stress levels: How stressed you're feeling
- Exercise: Physical activity that might affect your symptoms
- Hydration: Indicate daily water intake
To add a new diary entry, tap the + button and adjust the sliders to indicate (on a scale of 0-10) the level you want to assign to each item. You don't need to enter values for all items. Adjusting the slider to the far left value indicates "no entry" for that item. Each entry is stored with a timestamp so it can be correlated with your hearing test results and events in the Trends tab.
The Diary tab displays your entries in chronological order. Adjust the slider at the top to scroll to different saved entries. The date and time of the selected entry will be shown, and the various sliders (tinnitus, ear fullness, etc.) will be adjusted to their corresponding values. At the bottom of the screen there are buttons to let you edit or delete entries.
There is some overlap between the diary items on this tab and the events on the Events tab. For example a vertigo attack could be entered as an event on the Events tab or as a high value for "Balance Trouble" on the Diary tab. In general, "Events" are intended for discrete events such as vertigo attacks, and "Diary" items are intended for things that are more nearly always present, just in varying degrees. So a full vertigo attack would be an "Event", and a general long-term feeling of imbalance would be a "Diary" item.
Like events, diary entries can be displayed on the Trends plot to help you visualize correlations between your diary data and hearing levels.
Trends Tab
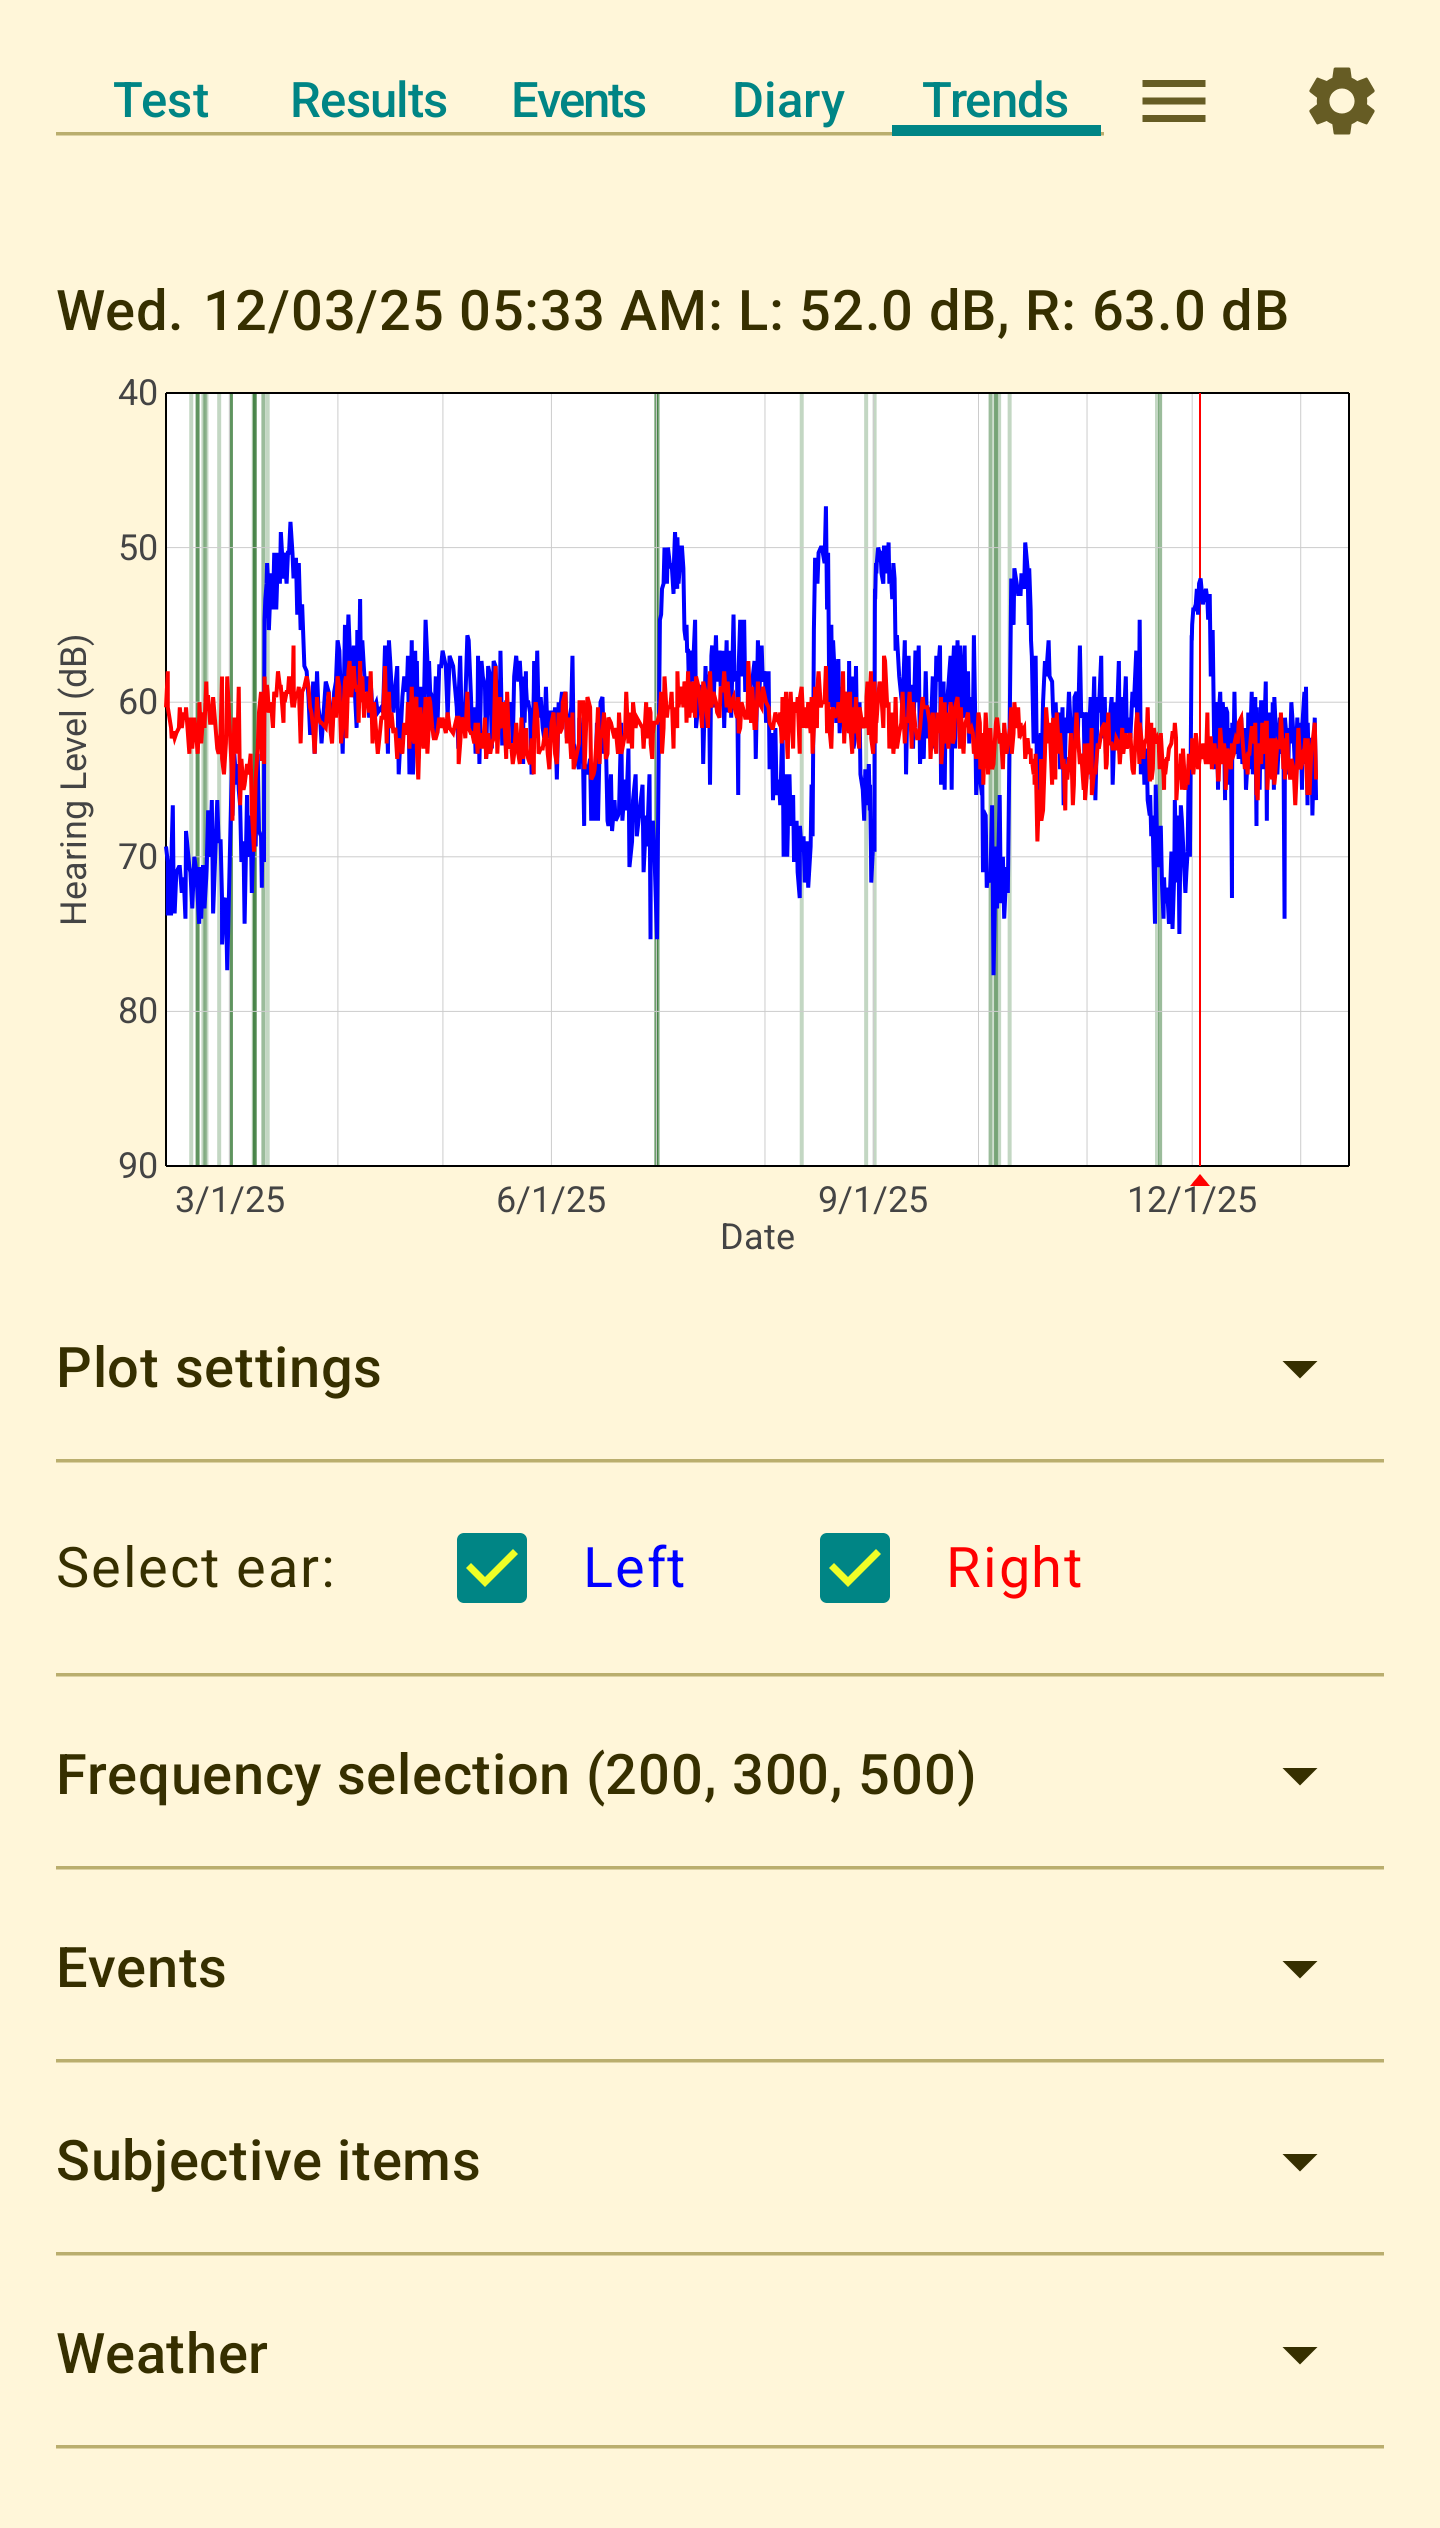
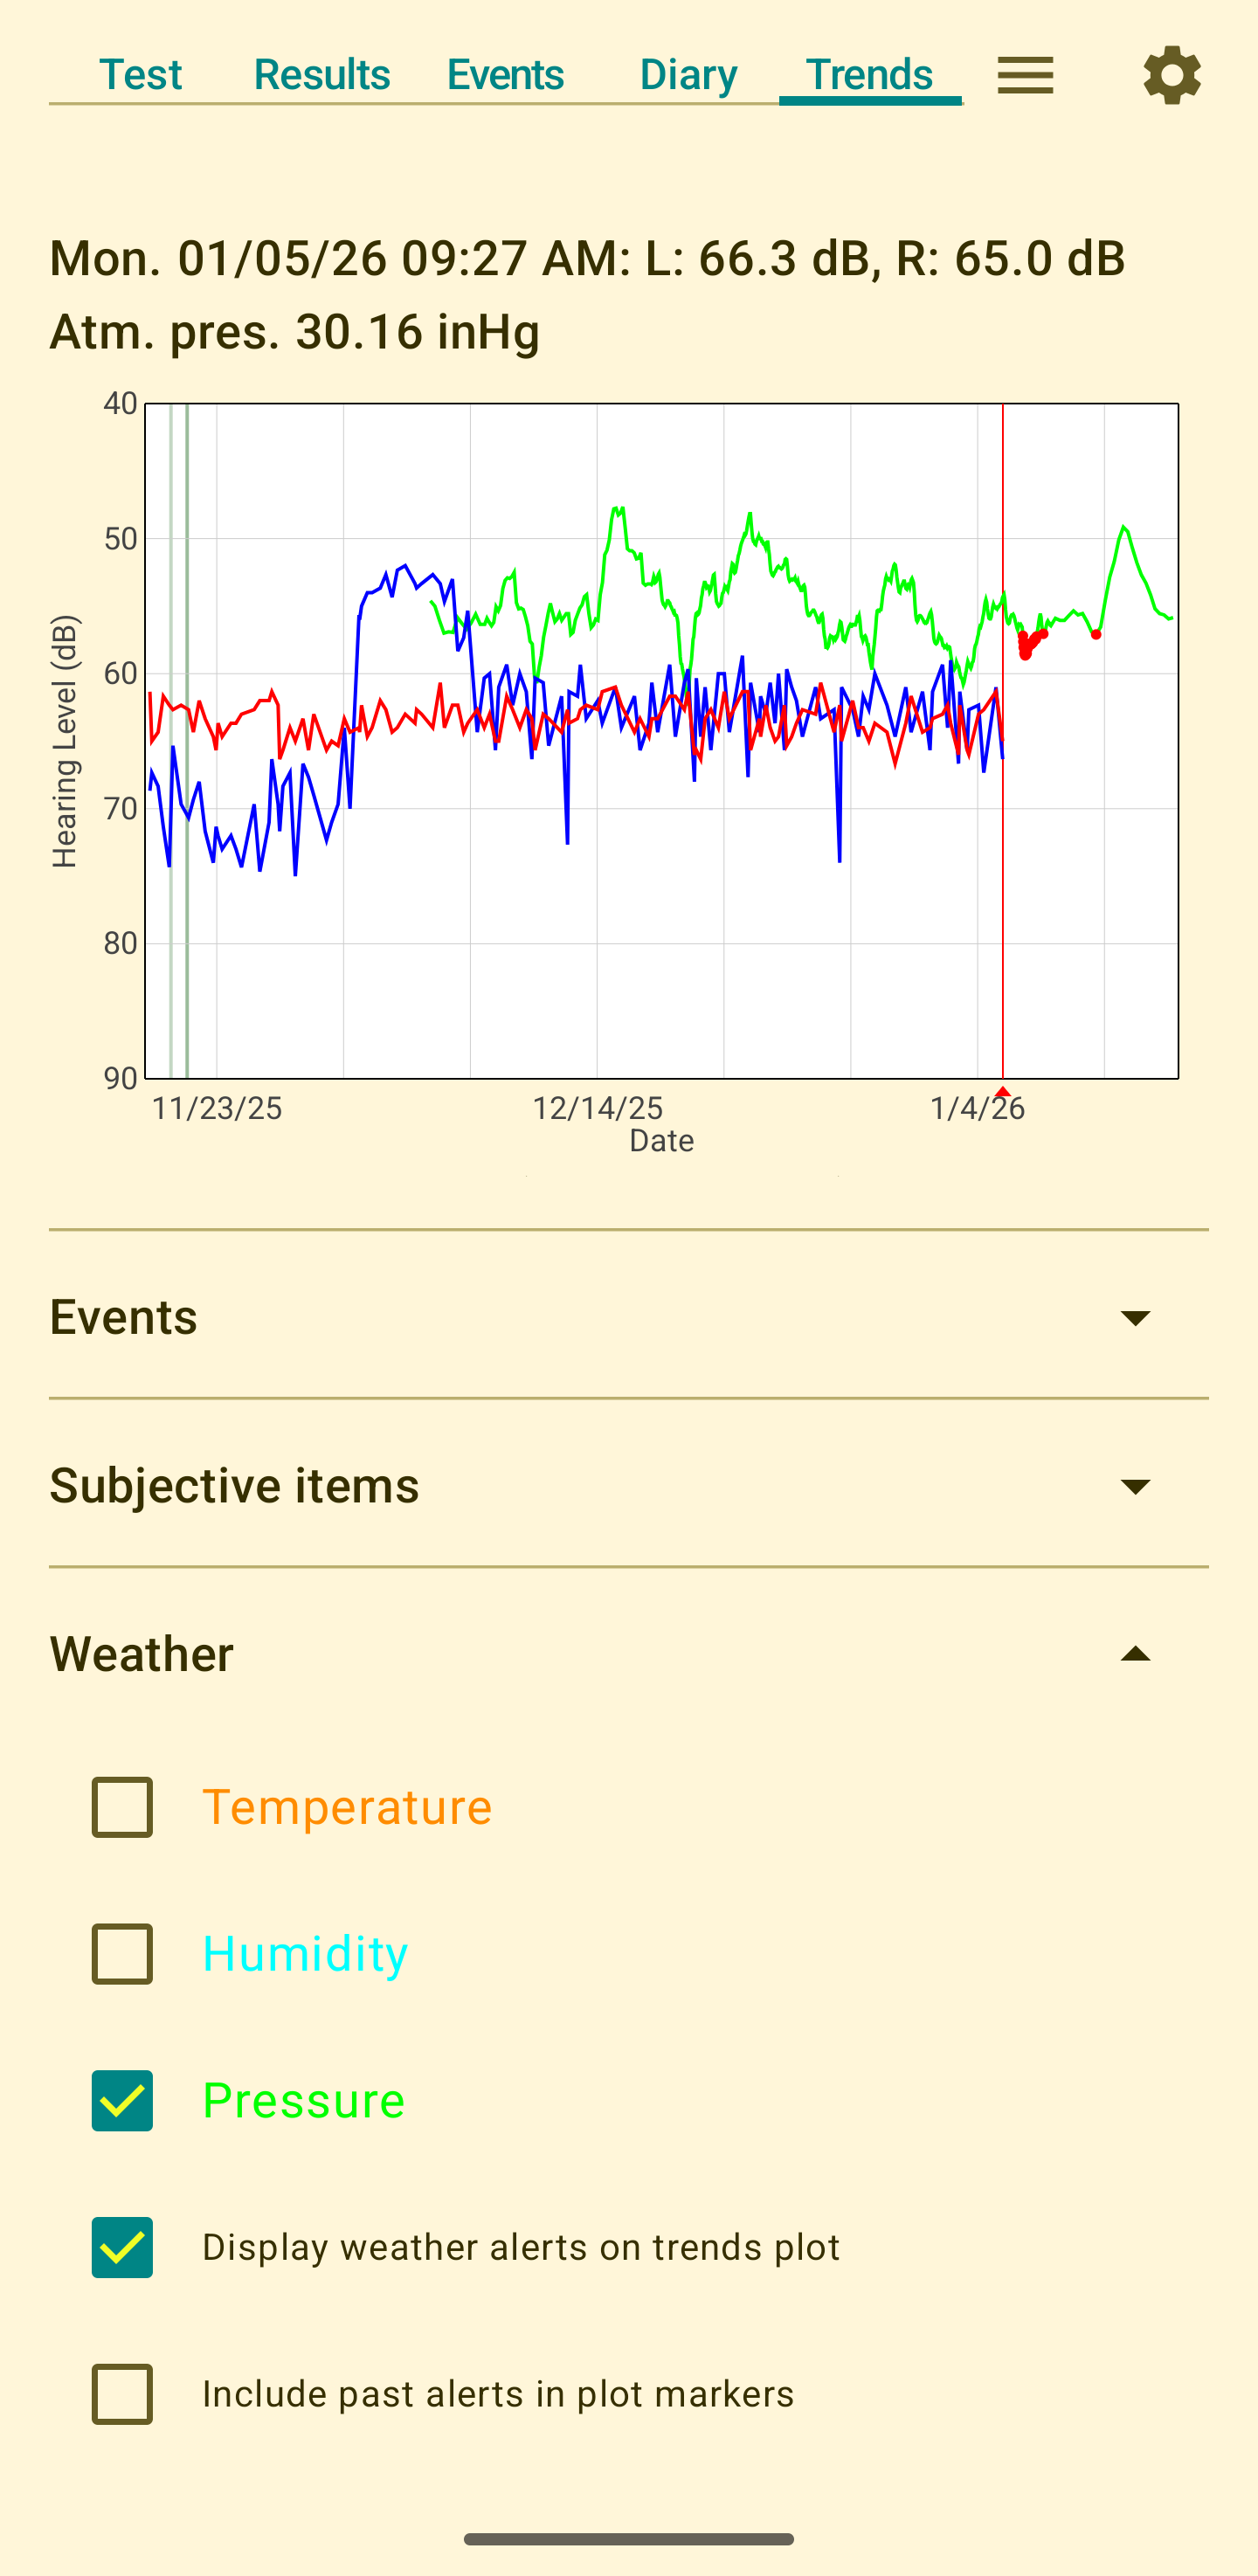
The Trends tab summarizes hearing levels over time and overlays annotations for key events. This helps visualize correlations between hearing level changes and events such as vertigo, medication changes, or symptom changes. There are no universally correct settings to use here. To some extent you need to be your own analyst, looking at different frequencies and different events, and seeing when useful patterns emerge. "Useful", in this context, means something that you can use to predict vertigo or to identify medication or other treatment that is effective. In the plot shown below, for example, the average of the 200, 300, and 500 Hz hearing thresholds is shown, giving a measure of low-frequency hearing loss variation over time. There is a clear relationship between the left ear hearing (blue line) level and the occurrence of vertigo (as indicated by the vertical green lines). There is no correlation between the right ear (red line) and vertigo, so we know the vertigo is caused by the left ear. Furthermore, variations in the left ear hearing level give a prediction of when vertigo is likely: a decline in hearing to 70 dB is a clear sign of impending vertigo. The several jumps from roughly 70 dB to 50 dB coincide with a temporary cessation of vertigo. While not shown here, if the Roaring event is selected, it is clear that those jumps are always accompanied by a large increase in tinnitus, i.e. a roaring sound. Note that detecting patterns is a long-term process. If you took any one-week section of this plot it would be unlikely to tell you anything at all. You need to collect data long enough to observe any patterns your symptoms may follow.
The red caret under the plot and the corresponding line through the plot area provide hearing data and weather data at a particular time. Moving the caret to a desired point in the plot timeline will produce a text description just above the plot showing results closest in time to the selected point. To move the caret drag it left and right across the bottom of the plot.
Your hearing progression will almost certainly look quite different from the example shown here. One of the main purposes of Menieres Biometrics is to help you determine your progression. Low frequency hearing fluctuation is a key symptom of Meniere's, so you might start by looking at low frequencies as shown below. But your hearing may fluctuate at different frequencies, so selecting different frequencies for the trends plot could be informative. If you have enabled weather data collection you could compare your hearing progression to atmospheric pressure to see if they are related. For all such variations on the trends plot you can select vertigo or other events to see if they are related to hearing fluctuations.
As always, don't make any important health decisions based on what you see in Menieres Biometrics. Errors in data collection or in understanding or interpreting the trends plot could lead to poor choices in disease management. Consult with a health professional before using Menieres Biometrics to make substantial changes in how you manage your disease.
Plot Settings
Under Plot Settings you have the option of displaying individual or averaged data. If you select individual, then each of the frequencies you select (in the Frequency selection section) will be plotted as separate lines. If you select Average, then the dB values of the selected frequencies are averaged together. This is generally more useful.
The Adjust for equipment change checkbox directs the app to attempt to smooth transitions due to equipment changes. If you've changed the headset you use, and have included that change in the events tab, then the app will try to adjust prior measurements to make them more consistent with current measurements. The Adjust for equipment change checkbox only adjusts prior measurements (and only on the plot -- the actual stored audiograms are never modified) so selecting or deselecting this feature will only change the display of old measurements -- the current measurements will be unaffected. Note that the adjustment this makes is very inexact, and is intended to improve the data slightly. As mentioned elsewhere, it is best to use a good headset and stay with that headset for all tests. Before changing equipment, if at all possible take an full (not short) audiogram with the old equipment, then switch to the new equipment and immediately take another full audiogram. This will improve the accuracy of the equipment adjustment.
Setting the minimum and maximum hearing loss values sets the Y-Axis range on the trends plot. The default values are initialized after your first audiogram and should be appropriate for your data. After you've performed several tests you can adjust the values to better fit your particular loss levels.
The "Auto-set Y Axis Limits" button will read through your test results and automatically set the Plot Y-Axis Range values to reasonable levels. You may then choose to adjust the levels further.
Select ear
You can select either or both ears for display on the trends plot. Right ear results will be plotted in red, and left ear results will be plotted in blue.
Frequency selection
You can select any frequencies for display. If under Plot settings you've selected individual, then each of the selected frequencies will be plotted as an individual line. If Average is selected, you'll get a single plotted line (per selected ear) representing the average of the selected frequencies.
Events
Checkboxes are included for each of the event types that may be entered on the Events tab. To keep the interface clean, only checkboxes for event types that have actual data in your event log are displayed. Selecting any of those will add annotations to the plot indicating the date and time of any events of that type. Event annotations are displayed as vertical lines on the plot. The color of the lines matches the text color of the different events. If you haven't entered any events of the selected type, checking the checkbox will have no effect. Perhaps the most common selection is to show vertigo events. This allows you to observe how hearing levels and vertigo attacks are related. Other events are likely also of interest. For example, if you've entered events for when you started a particular medication or treatment and select the Medication checkbox, you may be able to observe any improvements, or lack of improvements, provided by that medication.
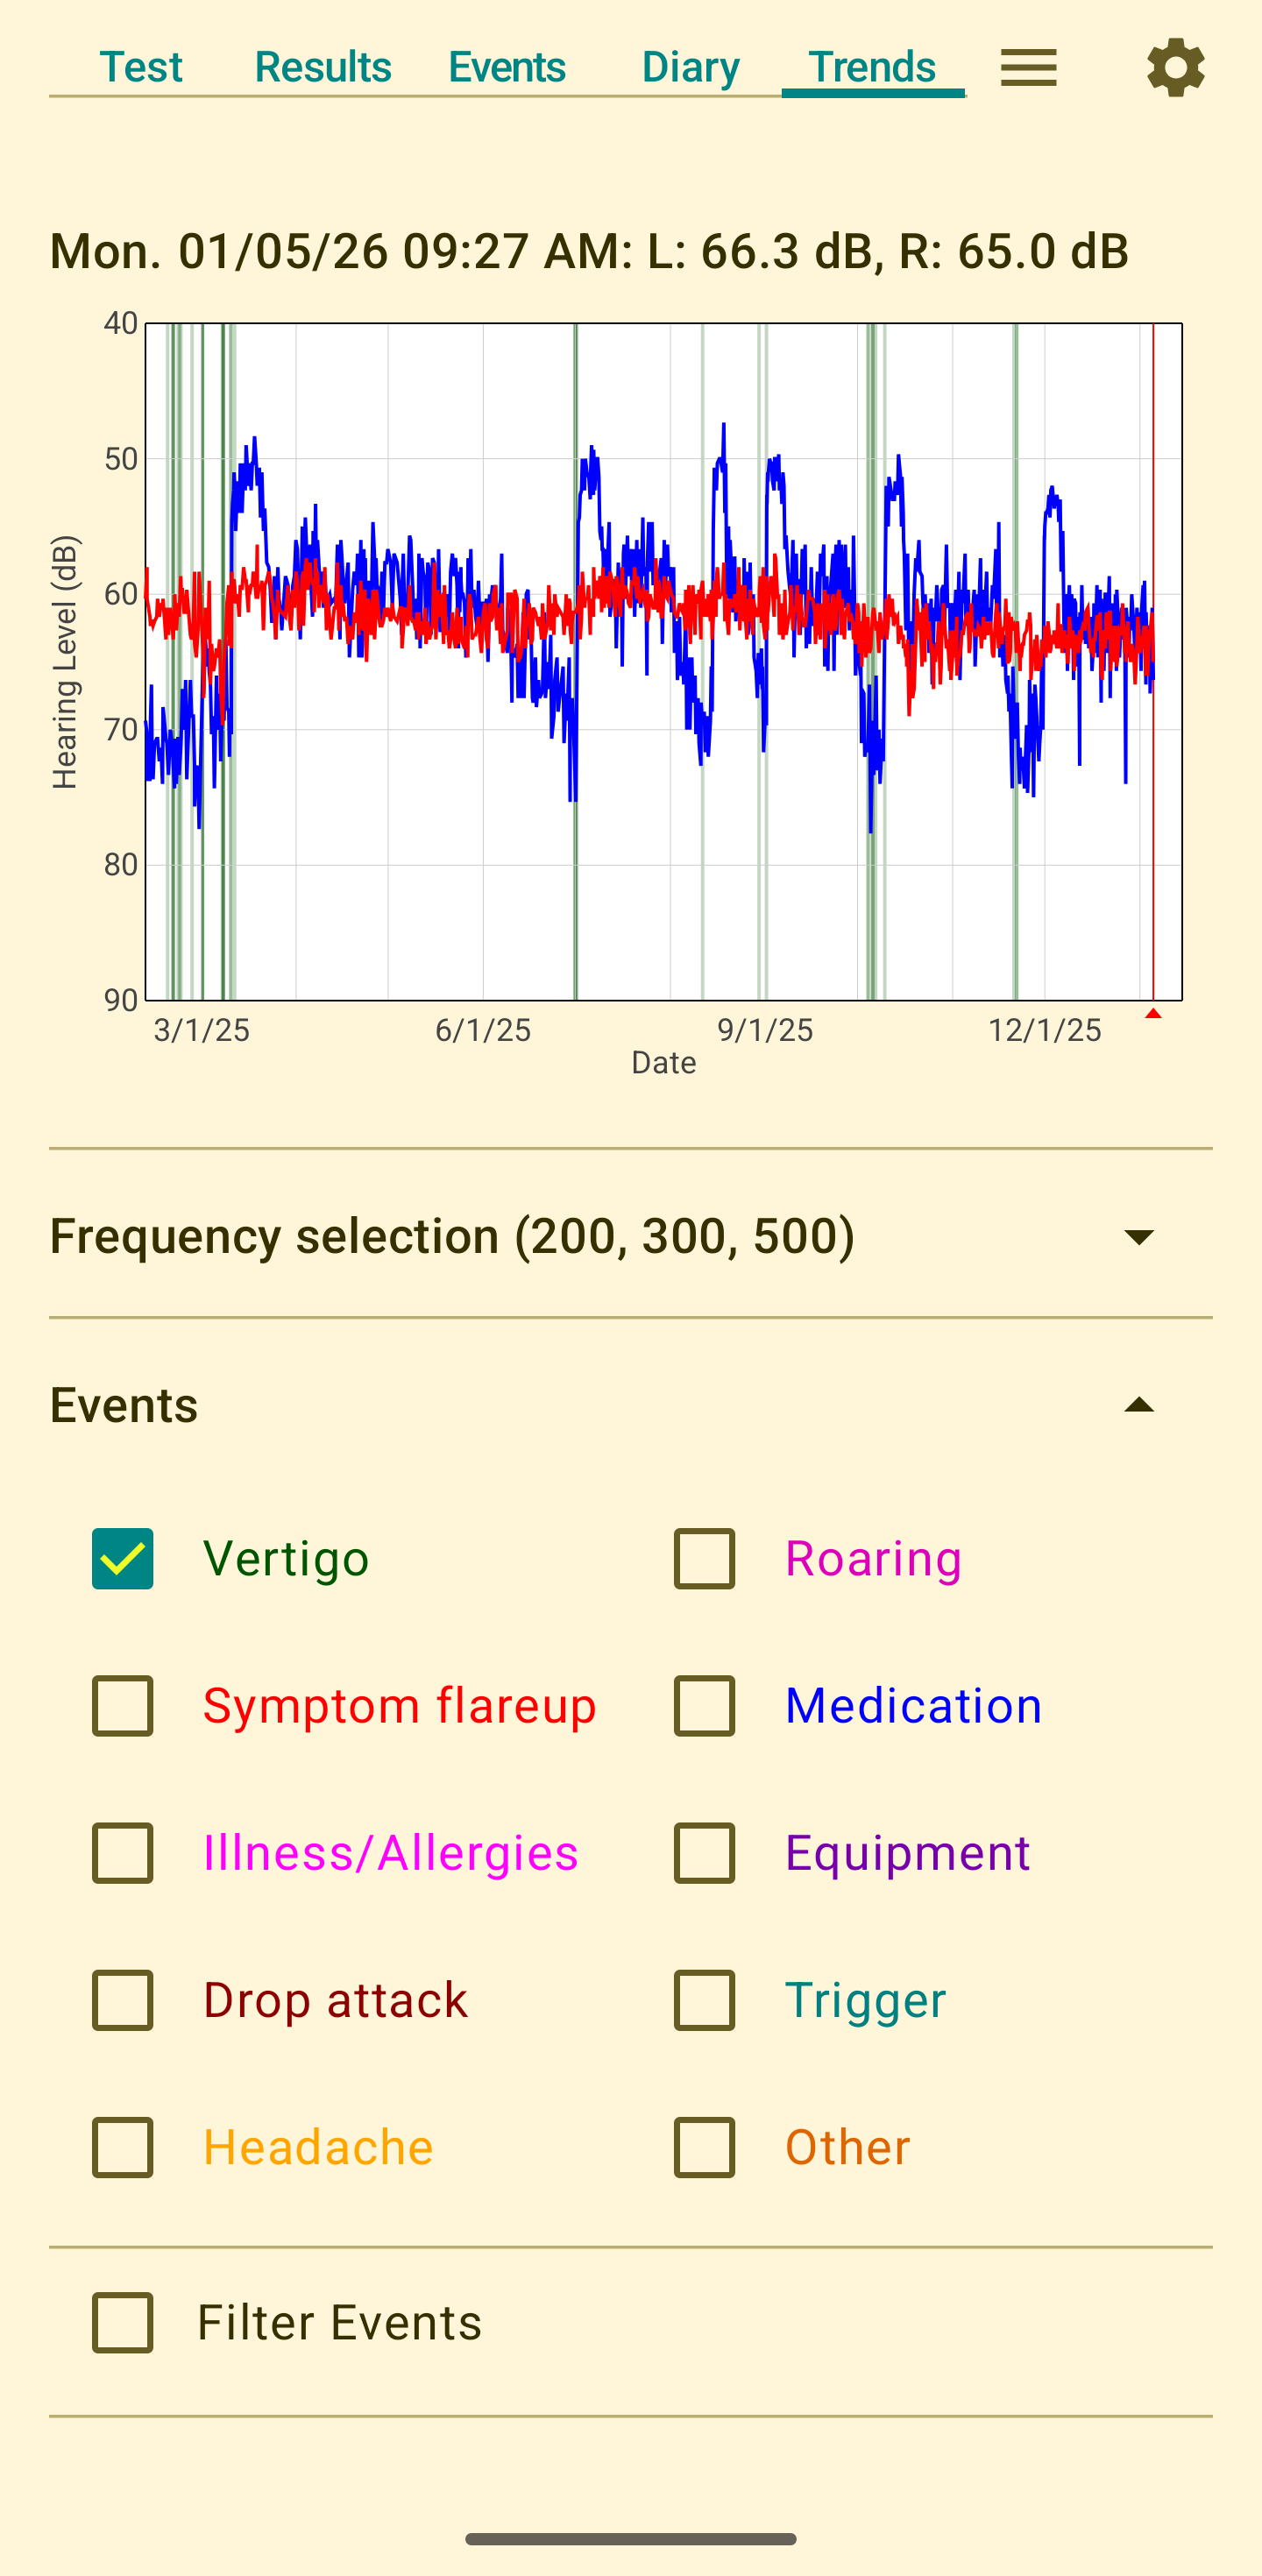
You can also filter events by text. This limits the annotations to only those that have comment fields containing the entered search term. This lets you, for example, filter on "Betahistine" to see annotations only pertaining to betahistine. This assumes you've included comments containing that term in the corresponding events, e.g. "Started betahistine".
Several of the event types include a duration and severity. For such events the width of the annotation line corresponds to the duration of the event, and the shade of the line indicates severity.
Diary items
Similar to events, the Trends tab can also show items entered on the Diary tab. To keep the interface clean, only checkboxes for diary items that have actual data entries are displayed. Select any items you want to add to the trends plot. If you haven't entered any data for the item, selecting it won't affect the plot. Diary items are plotted on a scale of 0 to 10, irrespective of the Y axis numbering. The bottom of the trends plot corresponds to a diary value of 0, and the top of the plot corresponds to a value of 10.
Weather overlay
The Trends tab can also show local weather data, including temperature, relative humidity, and barometric pressure, as separate lines on the plot.
Weather data is optional and is only collected when you enable the weather setting in the Settings screen. When enabled, Menieres Biometrics periodically fetches local weather data from the Norwegian Meteorological Institute (MET Norway) using approximate (coarse) location. If you haven't enabled weather alerts, forecasts are only obtained while Menieres Biometrics is in use, so if you only open Menieres Biometrics occasionally the weather predictions will be sparse and therefore less accurate than if you use the app more frequently. If you have enabled weather alerts, Menieres Biometrics will check for weather updates even if the app is not actively in use, so that you don't need to open the app to receive alerts.
The app only updates location information while the app is in use. If you travel, but don't open the app, it will continue to fetch weather data for the location of the phone the last time the app was used. Note that since there are safeguards in place to prevent excessive weather fetches, there can be a substantial delay between travel and when weather data corresponding to your new location is obtained.
Existing weather samples remain in your data even if you later turn weather collection off. Turning the weather setting off stops new downloads but does not delete past weather data or affect hearing test results.
On the Trends tab you can choose to show or hide temperature, humidity, and pressure using separate checkboxes. These curves are plotted on their own scale. The data cursor can be used to obtain values at selected points in time. You can also choose to display weather alerts on the plot. In the figure below these are the red points in the green line for atmospheric pressure. The marked points correspond to weather predictions that exceed the thresholds you've set in weather alerts. The Include past alerts option controls whether alerts from past forecasts are shown or only upcoming alerts. If you are certain that your symptoms are affected by atmospheric pressure, displaying alerts on the trends plot can help you anticipate future symptom flareups. If you are uncertain about the link between weather and symptoms, viewing past alerts and symptoms may help you identify (or rule out) correlations between pressure and symptoms.
Trend plot tips
- The trend plot can be panned or zoomed using standard gestures: pinch to zoom, swipe to pan.
- Double-tap to zoom out to view all data.
- Double-tap the right-hand quarter to zoom to the last month.
- Long-press a point to open the corresponding audiogram in Results.
- Tap an event annotation to see event details.
- The plot Y axis range is defined in the Plot Settings section of the Trends tab.
Settings
The Settings screen lets you set various parameters affecting app behavior.
Audiogram (ear selection)
You can configure the app to test only one ear during audiograms. This is useful if you have unilateral Meniere's disease or prefer to focus on tracking a single ear. When enabled, audiograms will only include thresholds for the selected ear, reducing testing time. You can change this setting at any time, and it will affect subsequent audiograms but not previously saved results.
Even with unilateral disease you may prefer to test both ears. This can give you a baseline indicator of your good hear, which could be useful if you do develop bilateral disease, or if you simply want something to compare your diseased ear to. Depending on your particular phone and headset, some hearing loss can appear without being detected by Menieres Biometrics, so don't rely on audiograms generated by Menieres Biometrics to diagnose bilateral disease.
Warning messages
This section lets you enable or disable the warnings normally generated at the start of a test -- one for setting the system volume and one for using sub-optimal equipment (non-wired headphones).
The app adjusts the tone volume during a test by adjusting the volume of the sound sent to your audio device, not by adjusting the system volume. For consistency from one test to the next, the volume should be set to its maximum value. If the volume is not already at its maximum a warning box will be produced, allowing you to set the volume to the maximum value, or continuing to take the test with the current volume (not recommended). Volume warning setting allows you to override the default behavior, having the app always adjust the volume to maximum without warning, or using the volume as it is.
As described in the section on equipment, it is best to use wired headphones for taking tests. If you are using wireless headphones or ear buds, you may find them to be adequate and not want to be questioned about their use each time you take a test. The "Warn if equipment is not wired" checkbox lets you enable or disable the warning.
Appearance
You can select the light/dark mode for the app. Selecting "Use device theme" will set the app mode to match the phone's theme. Selecting "Light mode" or "Dark mode" will override the system setting.
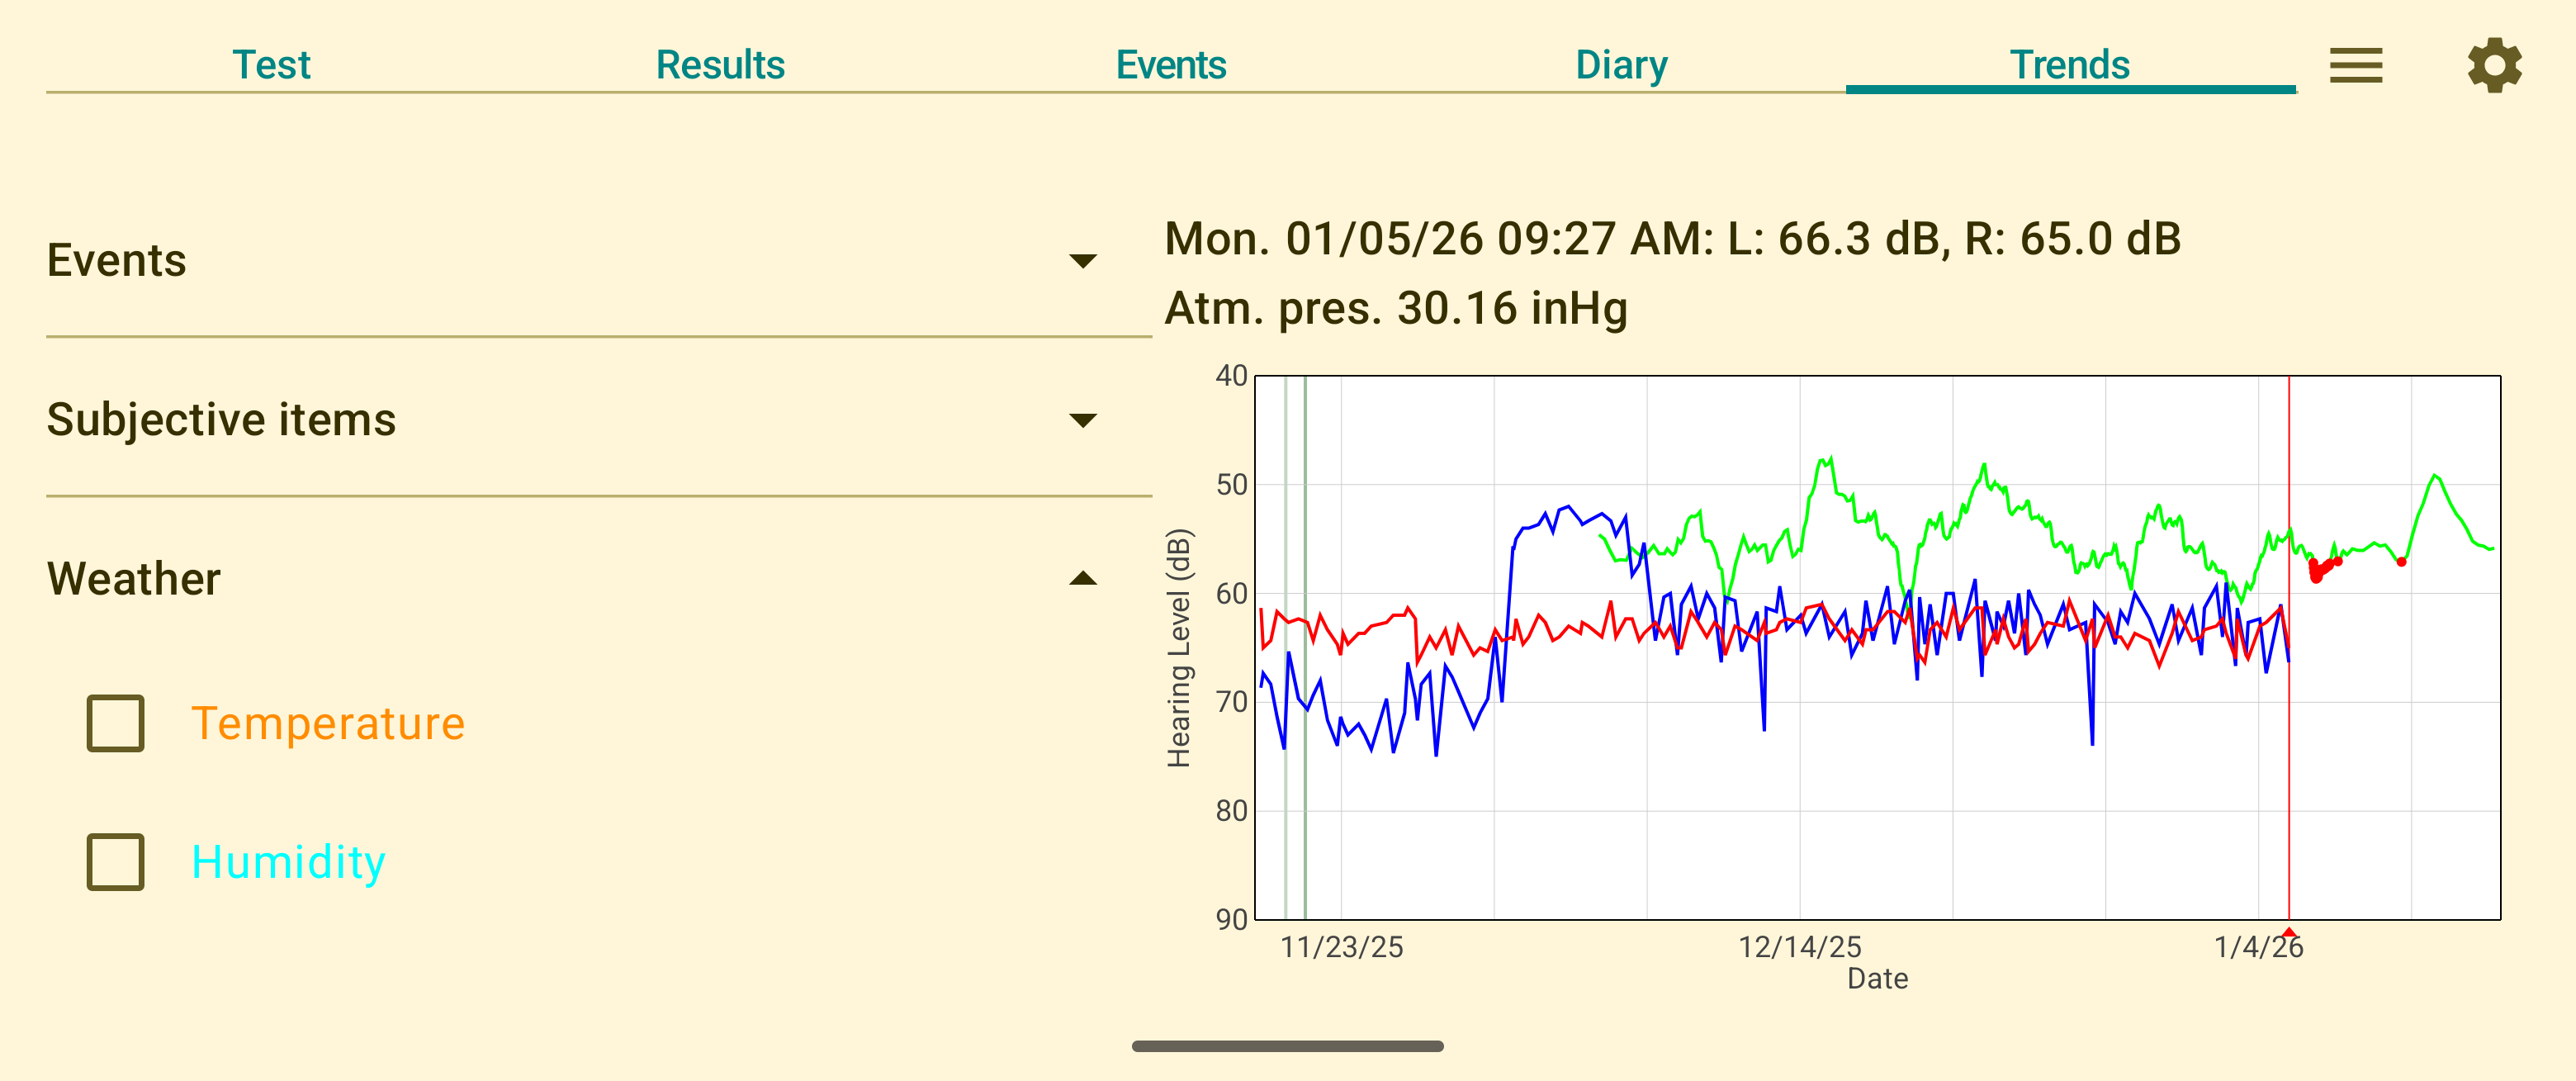
In landscape mode (holding the phone horizontally) the contents of the Test, Results, and Trends screens are organized in two columns. Options are provided to swap the left and right columns, letting you choose whichever arrangement is more convenient.
Weather
Menieres Biometrics can optionally collect local weather data (temperature, humidity, and pressure) and overlay it on the Trends plot. This can help you see whether symptoms correlate with weather changes.
The Settings screen includes a "Collect local weather data for Trends tab" checkbox. When you turn this on, the app requests approximate (coarse) location permission and periodically downloads weather forecasts from the Norwegian Meteorological Institute (MET Norway). The first time Menieres Biometrics tries to collect weather data it will ask you for permission to access your phone's coarse location. This is necessary for obtaining local weather data.
Weather samples are stored locally with your other data and are used only for plotting on the Trends tab and for CSV export. You can turn the weather checkbox off at any time to stop new weather downloads; existing weather data will remain available.
MET Norway provides public forecast data and asks apps to avoid unnecessary or excessive requests. Menieres Biometrics respects this by caching each forecast until the service reports that it will expire and by limiting how many times per day it will contact MET Norway. These limits help protect MET Norway's infrastructure and also benefit you by reducing battery usage and network data consumption. Only approximate location and weather requests are sent; your hearing tests, events, and diary entries are never transmitted to MET Norway.
Weather alerts
Weather alerts let you define thresholds for barometric pressure conditions. When weather forecasts exceed these thresholds, the app notifies you and can highlight those points on the Trends plot so you can see at a glance when weather conditions may be triggering symptoms.
Configuring alerts
To configure weather alerts, go to Settings and scroll to the Weather section. You must first enable weather collection to use alerts. Four types of pressure alerts are available:
- Pressure is above: Triggers when the forecast pressure exceeds your threshold.
- Pressure is below: Triggers when the forecast pressure drops below your threshold.
- Pressure increases by: Triggers when pressure is forecast to rise by the specified amount per hour.
- Pressure drops by: Triggers when pressure is forecast to fall by the specified amount per hour.
Pressure thresholds can be entered in either inHg (inches of mercury), mmHg (mm of mercury), or millibars (which is the same as hectopascals -- hPa), depending on your selected pressure unit in Settings. Typical sea-level atmospheric pressure is around 30.0 inHg (1013 hPa).
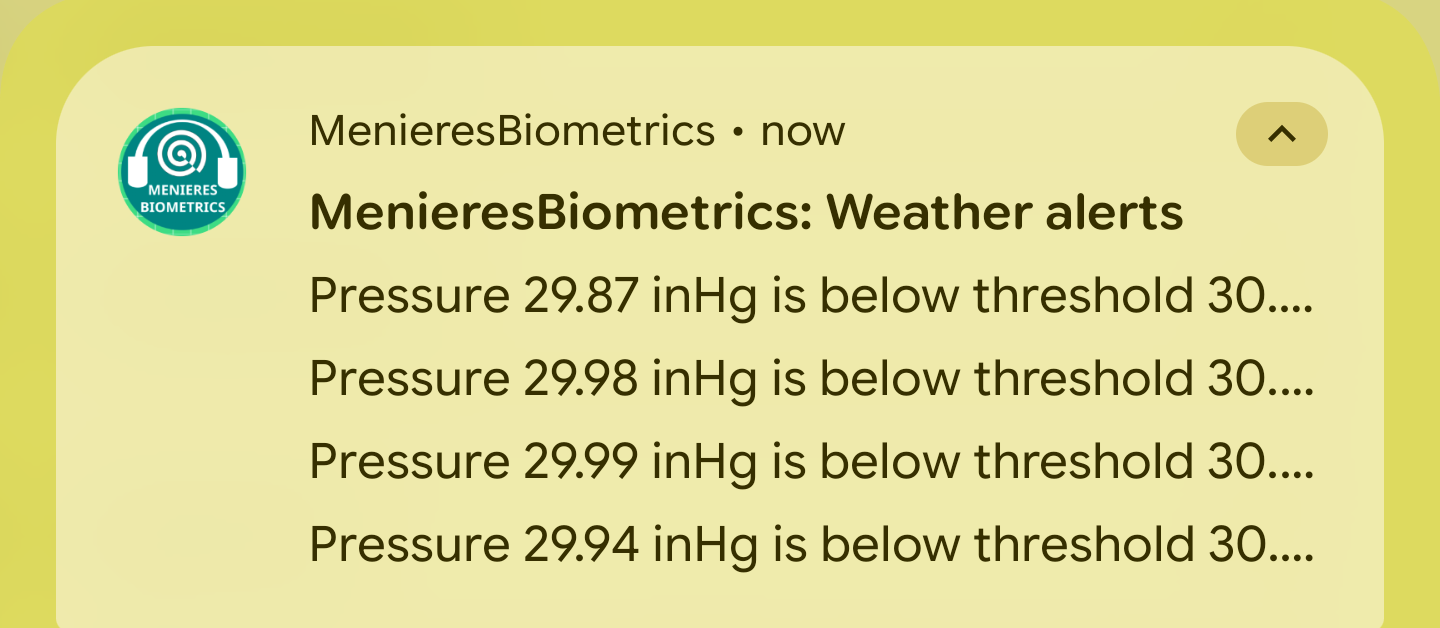
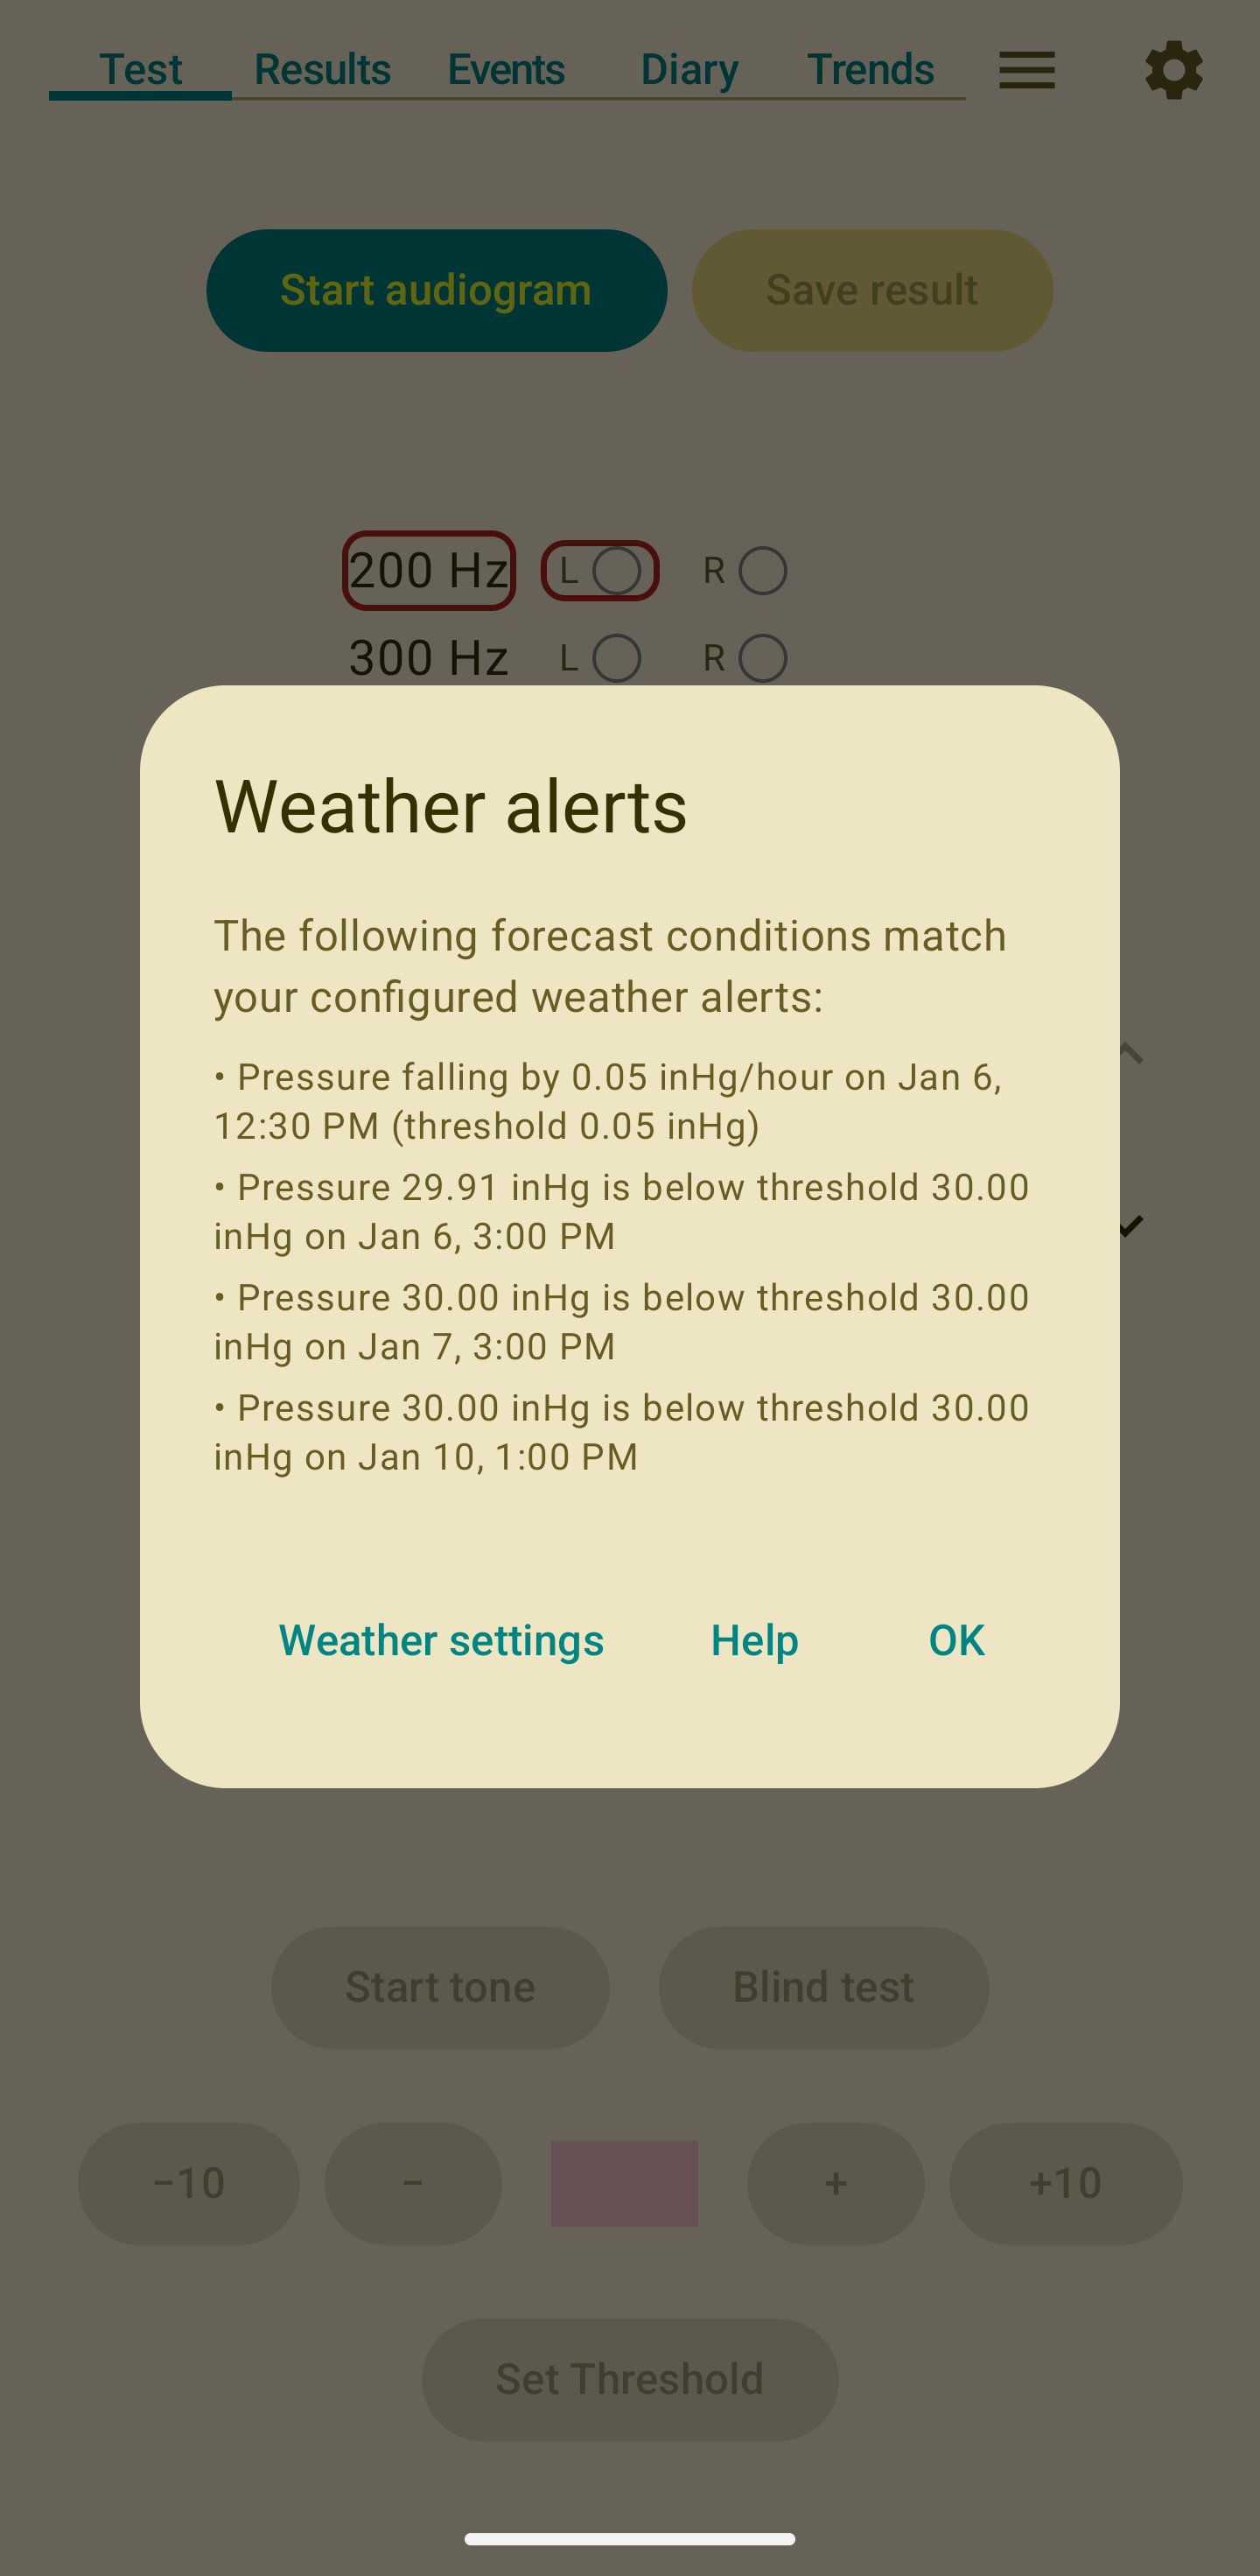
Alert notifications
When an enabled alert threshold is met, the app issues a system notification. Depending on your phone and Android version this will give a summary in the system Notification Shade, as seen in the figure below. If you tap that system notification it will display a complete list of notifications and the conditions that caused them, as seen in the screenshot below. Each alert shows the condition that was met, the date and time of the forecast, and the predicted value. The app requires notification permission (Android 13+) to display these alerts. You can also view this list of notifications by using the "Show current weather alerts" menu item.
Approximate Calibration
The hearing levels recorded by Menieres Biometrics will depend greatly on the headset being used and on your phone's audio output level. Unfortunately there's no way for Menieres Biometrics to know the sound levels your phone and headset will produce. You can determine a reasonable calibration offset two ways:
- Compare audiograms produced by Menieres Biometrics to audiograms you have from an audiologist. The Calibration Offset you enter in the Settings screen should be based on the difference between Menieres Biometrics audiograms and professional audiograms. So, for example, if a professional audiogram gives a general hearing level of 25 dB and Menieres Biometrics reported 45 dB, you would set the Calibration Offset to the difference between the two, i.e. 20 dB. Note that even with a good calibration offset value you shouldn't expect perfect agreement between Menieres Biometrics and a professional audiogram. The point of the calibration offset is to bring the two into closer agreement, though perfect agreement is unlikely.
- Ask someone with normal hearing to take an audiogram with Menieres Biometrics. View the result on the Results tab. If their hearing is, for example, typically around 20 dB, then add 20 to the Calibration offset on the Settings screen. Then go back to the results tab and view the result. It should now be near 0 dB. Note that few headsets have perfectly flat frequency response, so you won't see 0 dB hearing loss for all frequencies even if the person you asked to perform a test has perfect hearing.
If neither of these approaches is convenient, you can simply leave the calibration offset set to 0. You will still be able to observe hearing level changes over time, but the absolute hearing level will be uncalibrated and therefore incorrect.
If you use method 2 above, after determining a reasonable calibration offset you will probably want to delete that audiogram from your results list since it measured someone else's hearing, not your own.
Note that even with a good calibration value the results won't be fully "calibrated" in a technical sense. All the Calibration Offset does is display your Menieres Biometrics results in a manner that more closely matches your true hearing loss. This is imprecise, but as stated elsewhere Menieres Biometrics can't provide highly accurate hearing loss levels. The main information provided by Menieres Biometrics is the change in your hearing levels over time. This is unaffected by the calibration level, and is also unaffected by imperfections in the frequency response of your phone and headset (within reason). So don't be overly concerned about entering a precise calibration offset term.
Backup Settings
After saving an audiogram you may get a reminder to back up your data. This setting allows you to specify how often you will be reminded to make a backup. See Saving, exporting, and backing up data for further details.
Analytics & Crash Reporting
Menieres Biometrics can collect anonymous indicators of app usage through Google Analytics, and crash reports through Firebase Crashlytics. This allows us to see, for example, how many users are using the app, how often audiograms are taken, and whether the app is crashing. No test results, events, or personal information are included. The information provided is anonymous.
Deselecting the checkbox will stop both usage statistics and crash reports from being sent. The app features and behavior are unaffected by your selection.
Saving, exporting, and backing up data
All of your data is stored within the app. To create a backup use the "Create data backup" menu item. This creates a comma-separated-variable (CSV) file that contains your audiogram results, any stored weather samples, and your events. CSV files are simple text files that can be read by spreadsheets and other programs.
The backup CSV is divided into sections for audiogram test results, events, diary entries, and weather data. Any comments you enter in event descriptions and diary entries are included in the CSV file. The CSV file does not include anything you entered on the Settings screen.
The "Load data from backup" menu item can read a previously exported backup CSV file. If you had to reinstall Menieres Biometrics or have otherwise lost your data, importing the saved CSV file will restore your audiograms, any backed-up weather samples, and your event log. After a full reinstall, any settings you made on the Settings screen will be lost and will need to be re-entered (the CSV file will not restore settings). If you import a file to a fresh Menieres Biometrics install, i.e. one without any data, then all data in the CSV file will be imported. If you import a file to a device with pre-existing data, then the data in the imported file will be merged with the existing data. In such cases the two devices may not have identical data after the import.
The Settings screen allows you to specify how often you should be prompted to create a backup file. This prompt will appear after you've saved an audiogram. The prompt will include a button that exports the data, so you may not need to use the "Create data backup" menu item on a regular basis.
However often you create backups, it would be wise to ensure that the backup is actually being created. The location in which you store the file is up to you. Navigate to that location on your phone, and check that the CSV file is there and not empty. Clicking on it will generally let you view the contents, though this is dependent on apps that your phone may or may not have.
If you save backups to a local folder, i.e. one on your phone, a message will appear advising you to use off-device backup instead, for example a Google Drive folder. That way if your phone is lost, stolen, or disabled, you would still have a backup available. If all backups are on your phone, then loss of your phone means loss of your data.
Backup files created by "Create data backup" store the raw values collected during hearing tests plus any corresponding weather samples. These raw values are not hearing level values; calibration is applied only when graphs are drawn or when you export data for analysis.
If you want to analyze your data in another program (for example, a spreadsheet), use the "Export data for analysis" menu item. This creates a CSV file that is similar to the backup file but uses dB hearing levels rather than the raw measurements included in the backup CSV. The analysis CSV is for external analysis only and cannot be loaded back into Menieres Biometrics. The analysis CSV will contain all of the audiogram data, all events (including any comments), all diary subjective values, and weather data. It does not include diary text entries.
Note that analysis exports are unadjusted for equipment. If your data spans multiple headsets, the values will include shifts caused by those equipment changes.
All CSV files are simple text files that can be viewed directly on most phones. Before sharing a CSV file with anyone you should review the contents of the file to make sure you are comfortable sharing the contents.
Switching to a new phone
On most devices, Android can automatically restore Menieres Biometrics data (audiograms, events, and settings) to a new phone when you sign in with the same Google account, provided that system backups are enabled. The backup and restore process is handled by Android/Google and may occur during device setup or shortly after installation. Even if automatic restoration is expected, making a backup of your data is highly recommended.
If you prefer a manual transfer, or if automatic restore is not available on your device, you can export a CSV backup from your old phone and import it on your new phone:
- On the old phone, use the menu to Create data backup and save to cloud storage
- Install Menieres Biometrics on the new phone
- Use the menu to Load data from backup and select the exported CSV
After switching, verify your audiograms and events are present on your new phone before disposing of or resetting your old phone.
PDF Generation
The "Generate Printable PDF" menu item will produce a PDF file with your latest audiogram and a copy of the trends plot. The trends plot in the PDF will match the trends plot within the app. This includes ear selection, frequencies, zoom/pan, and events. The menu item will be disabled until you've viewed the Trends tab.
Trends Plot PNG Generation
The "Generate Trends Plot File" menu item will create a PNG graphic file with the trends plot. As with the "Generate Printable PDF" menu item, the trends plot in the PNG will include ear selection, frequencies, zoom/pan, and events. The resulting PNG may be useful if you want to include your trends plot in an email or other document, or share it with others.
Open Source Licenses
Menieres Biometrics includes open-source components. These are used under their respective licenses. The main components and licenses are listed below:
- AndroidX and Jetpack Compose — Apache License 2.0
- Room (AndroidX Room) — Apache License 2.0
- DataStore (AndroidX) — Apache License 2.0
- Google Material Components — Apache License 2.0
- Accompanist System UI Controller — Apache License 2.0
- desugar_jdk_libs — Apache License 2.0
License texts and more information can be found on the respective project pages.
Analyze Audio
The Analyze audio item in the main menu (hamburger icon in the top bar) opens a dialog that reports on your phone's audio hardware and software configuration. This can help you understand whether your device is well-suited for accurate low-level hearing tests.
At the top of the dialog is a color-coded summary card:
- Green: The device reports audio hardware that should support accurate testing at very low hearing levels.
- Amber: The hardware capabilities could not be fully confirmed, or there is some ambiguity about the audio precision available. Testing should still be usable, but accuracy at very low thresholds may be reduced.
- Red: The device appears to be limited to 16-bit audio, or one or more audio effects are detected as enabled on the app's audio session. Either condition may reduce accuracy, particularly for quiet tones.
The summary card also notes whether any audio effects — such as a Loudness Enhancer or Equalizer — are detected as active. Effects can alter the amplitude of quiet tones and reduce test accuracy. The card also notes that some phone-level settings, such as Adaptive Sound or Dolby Atmos toggles in your phone's Sound settings, cannot be read by apps and are therefore not reflected in the analysis.
Below the summary card, the dialog shows more detailed technical information:
- App Audio Configuration: The audio encoding and sample rate used by Menieres Biometrics.
- Hardware Properties: The native hardware sample rate, buffer size, and the best PCM bit depth reported by connected output devices.
- Media Volume: The current media volume level.
- Direct Playback Support: Whether audio can bypass the software mixer and go directly to the hardware (requires Android 10 or later).
- Installed Audio Effects: All audio processing effects installed on the device. Effects that are currently enabled are highlighted in red as a warning.
- Connected Output Devices: All audio output devices recognised by the phone. The device most likely to be active during an audiogram is listed first under “Likely active for audiogram”; any remaining devices are listed under “Other output devices”.
About
Menieres Biometrics helps you measure and track hearing thresholds over time. It was designed with Meniere's disease patients in mind, and supports logging events such as vertigo and tinnitus changes to help visualize correlations with hearing trends.
Menieres Biometrics is a product of Menieres Biometrics LLC.
For questions, support, or feedback, please contact us at: [email protected]
Version: 1.0.20
Privacy: All data is stored locally on your device unless you choose to export it or your phone settings allow automatic app data backup. See Privacy for details.
Disclaimer: This app is not a substitute for professional medical diagnosis or treatment. See the Disclaimer.